Open Access
Fig. A.1.
Download original image
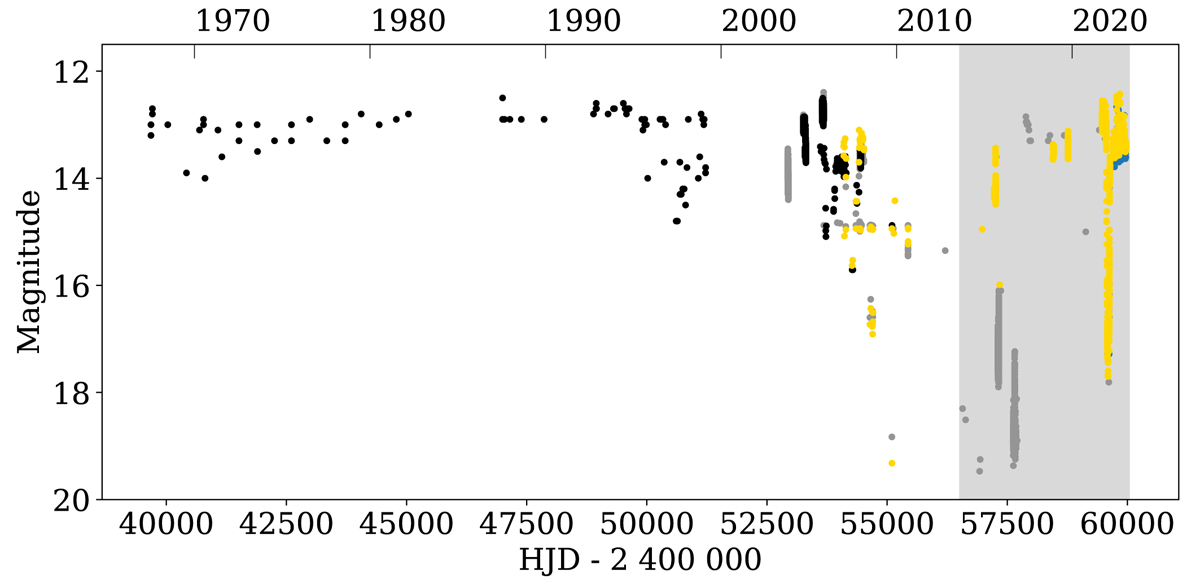
AAVSO optical light curves of V704 And. The yellow, blue, black, and grey circles show the B, V, visual, and unfiltered CCD measurements, respectively. We indicate the period with the grey shaded area, which is shown in the top panel of Fig. 1.
Current usage metrics show cumulative count of Article Views (full-text article views including HTML views, PDF and ePub downloads, according to the available data) and Abstracts Views on Vision4Press platform.
Data correspond to usage on the plateform after 2015. The current usage metrics is available 48-96 hours after online publication and is updated daily on week days.
Initial download of the metrics may take a while.