Open Access
Fig. 2.
Download original image
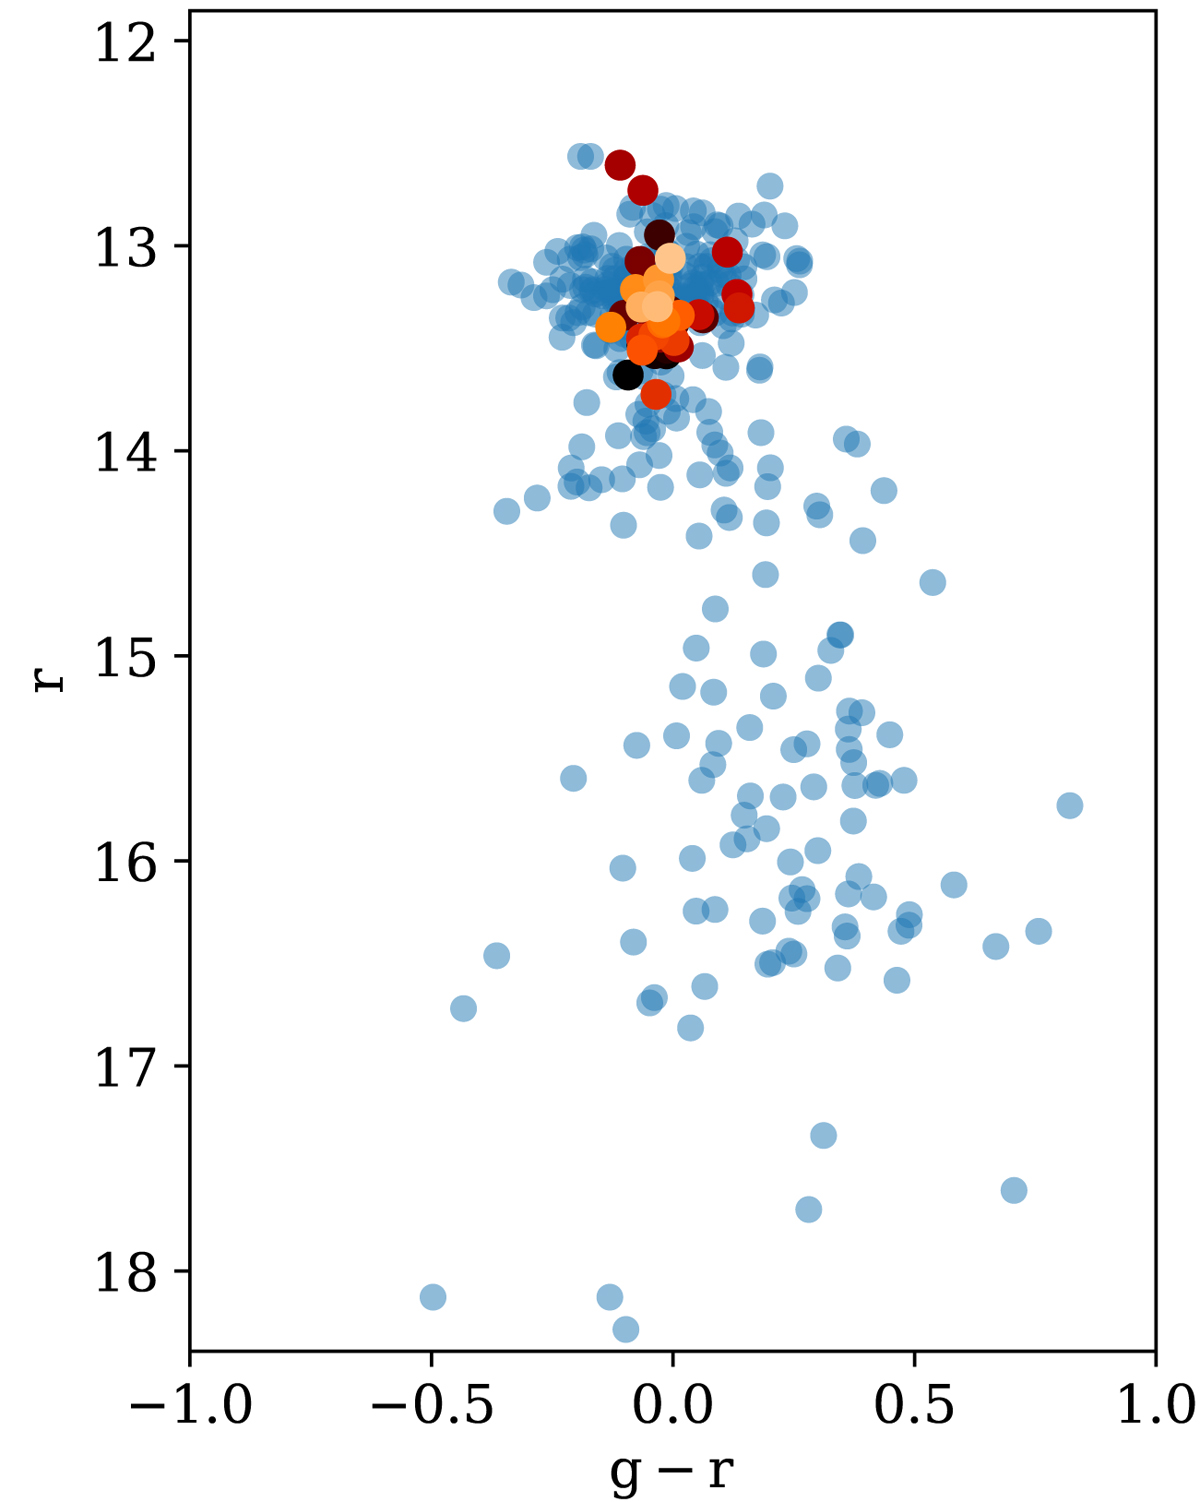
Optical colour–magnitude diagram based on the ZTF measurements. The blue filled circles show the entire dataset, whereas the orange ones cover only the period between JD − 2450000 = 9740 and 9890, i.e., when the three flares occurred. The measured errors are smaller than or equal to the symbol size.
Current usage metrics show cumulative count of Article Views (full-text article views including HTML views, PDF and ePub downloads, according to the available data) and Abstracts Views on Vision4Press platform.
Data correspond to usage on the plateform after 2015. The current usage metrics is available 48-96 hours after online publication and is updated daily on week days.
Initial download of the metrics may take a while.