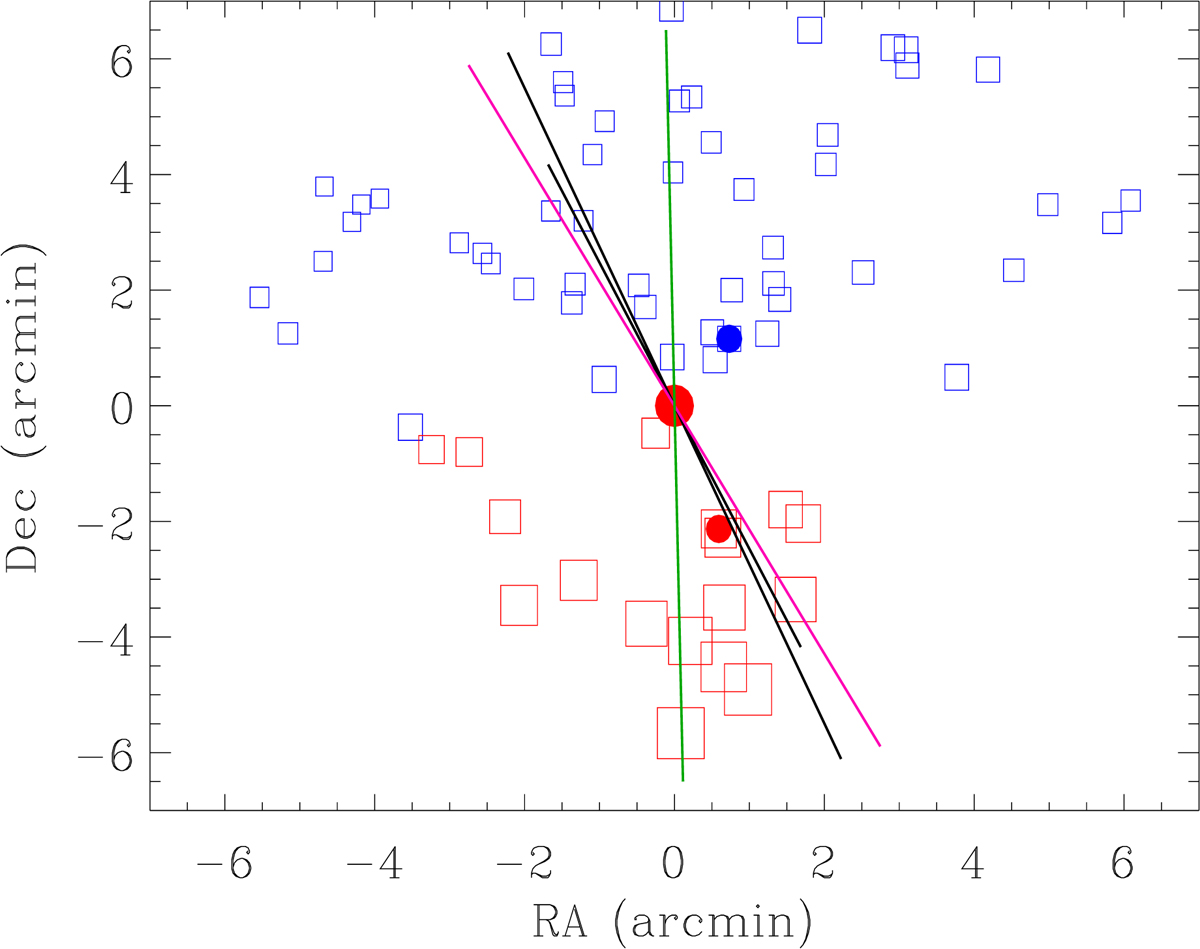
Fig. 7.

Download original image
Spatial distribution of the 78 cluster members inside a region of 7.5′×7.5′, 0.65 Mpc (∼0.6 r200) at the cluster redshift, from the cluster centre. Cluster member positions are marked with a square with size proportional to exp(δi) computed using the δi deviations obtained in the DS test. Red and blue correspond respectively to galaxies with higher and lower δi deviations from the mean, ⟨δi⟩. The large and small black lines represent the directions of the velocity gradients of the whole sample in the inner region, respectively. Similarly, the magenta and green lines represent the orientations of the galaxy density distributions and X-ray surface brightness map, respectively. The BCG, BCG2 and BCG3 positions are marked with filled dots.
Current usage metrics show cumulative count of Article Views (full-text article views including HTML views, PDF and ePub downloads, according to the available data) and Abstracts Views on Vision4Press platform.
Data correspond to usage on the plateform after 2015. The current usage metrics is available 48-96 hours after online publication and is updated daily on week days.
Initial download of the metrics may take a while.


