Fig. 1.
Download original image
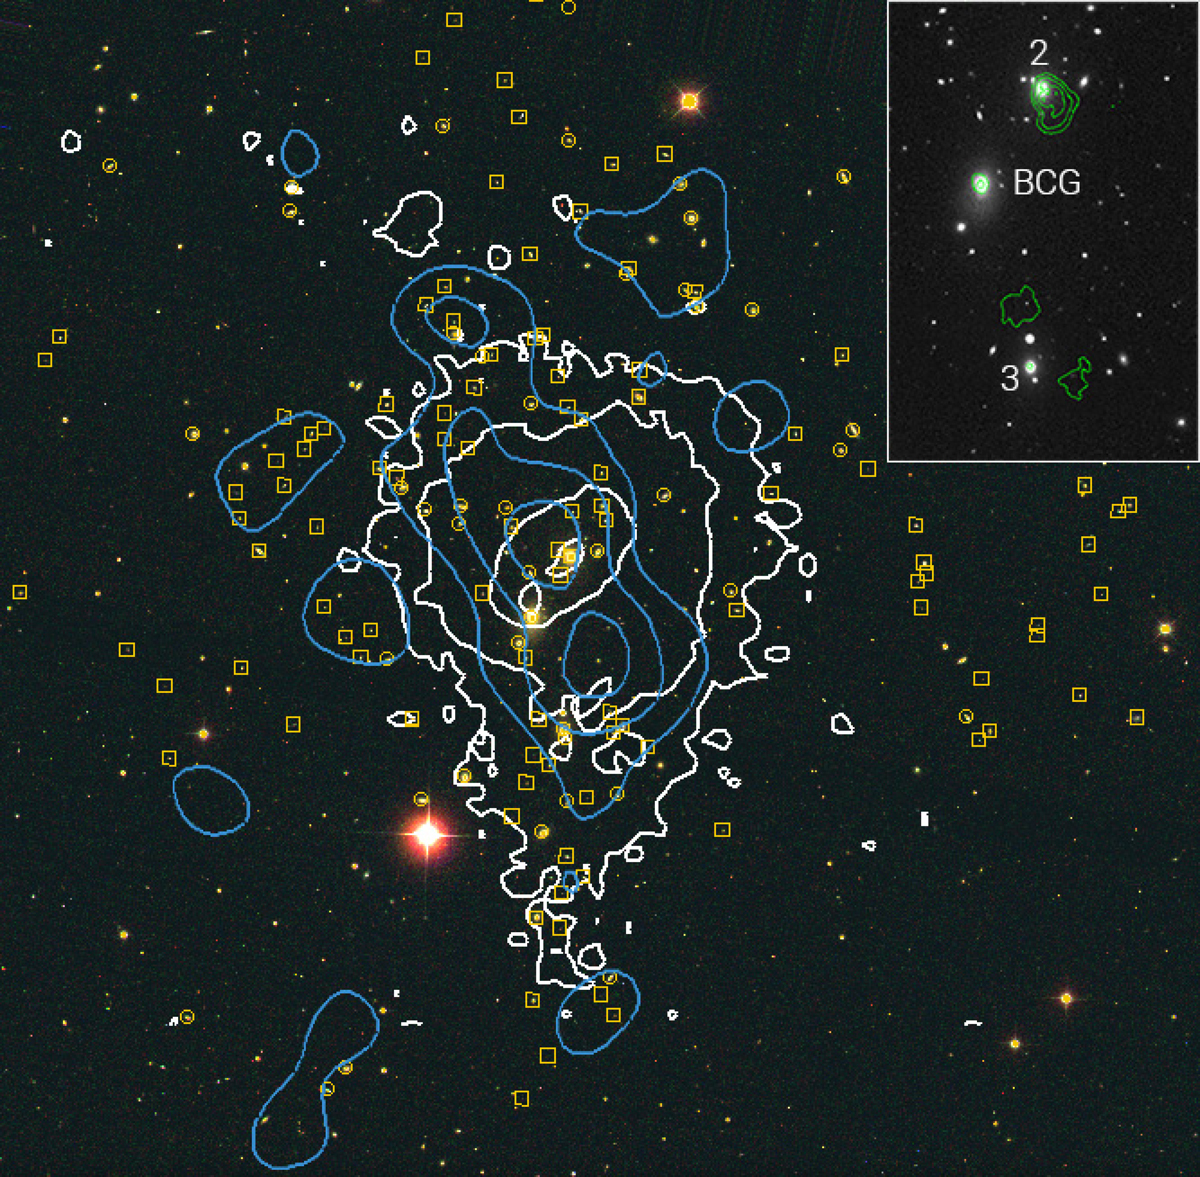
RGB colour composite image obtained by combining g′-, r′-, and i′-band images of 23′×23′ field of view from the Pan-Starrs1 public archive. Yellow squares and circles indicate the galaxies observed in our spectroscopic MOS observations and SDSS-DR16 spectroscopic redshifts, respectively. The blue contours show the isodensity galaxy distribution of likely cluster members (see Sect. 3.3). The white contours correspond to X-ray surface brightness after removing point sources using a pixel mask. In the upper right corner, the inset shows a magnified image of the cluster core. The labels BCG, 2 and 3 indicate the brightest cluster galaxy, and the second and third brightest galaxies, respectively. The green contours represent the diffuse radio emission observed with the VLA. North is up and east to the left.
Current usage metrics show cumulative count of Article Views (full-text article views including HTML views, PDF and ePub downloads, according to the available data) and Abstracts Views on Vision4Press platform.
Data correspond to usage on the plateform after 2015. The current usage metrics is available 48-96 hours after online publication and is updated daily on week days.
Initial download of the metrics may take a while.