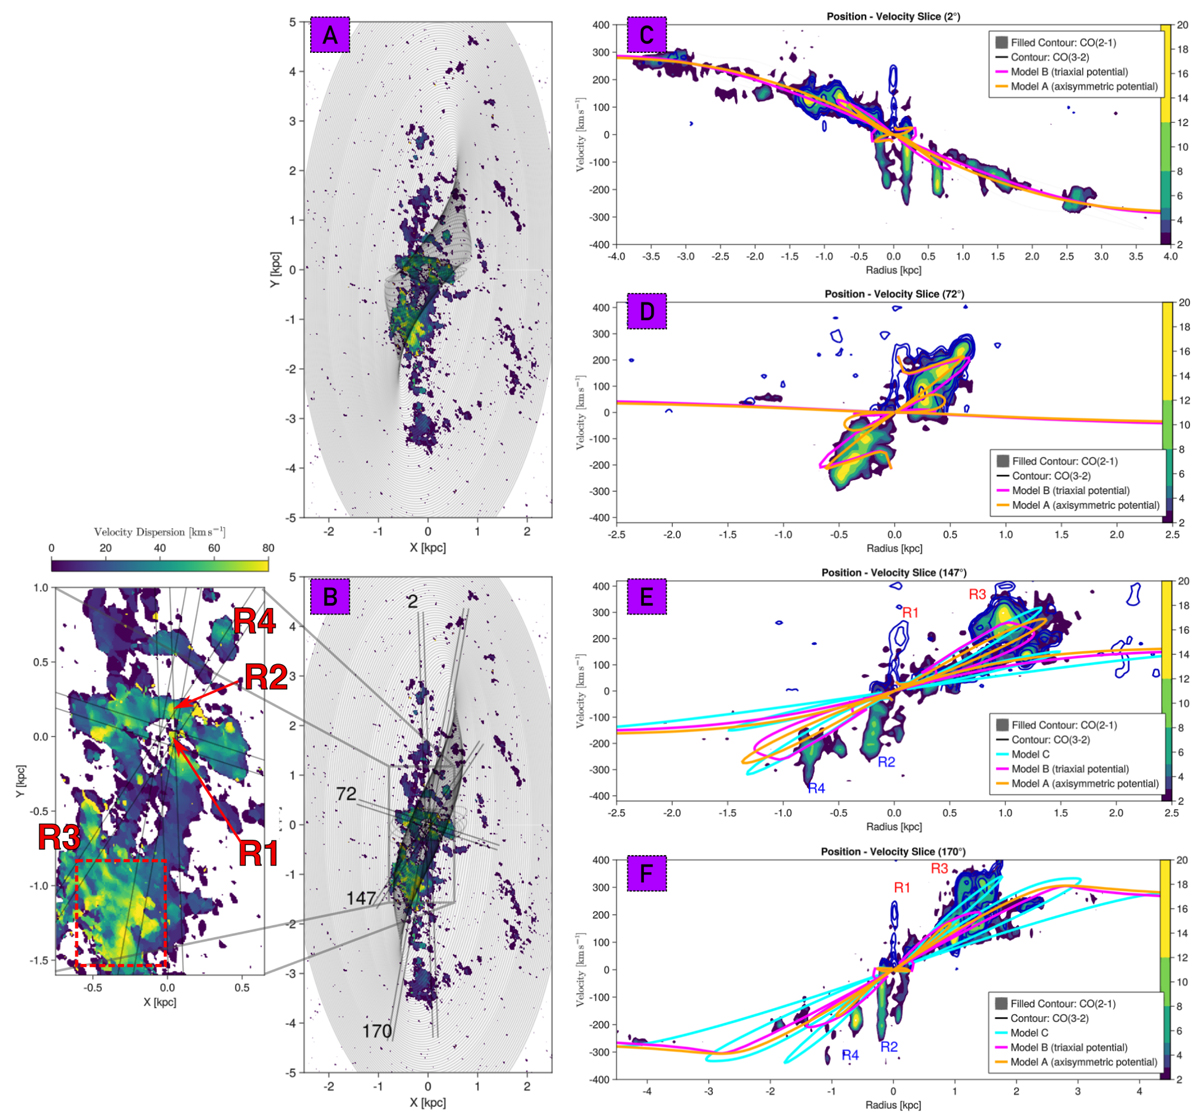
Fig. 7.
Download original image
Position velocity slices of CO(2 − 1) and CO(3 − 2) emission cubes. Panels A and B: sky-projected tilted rings for the axisymmetric potential model (A) and the triaxial potential model (B) embedded on top of the CO(2 − 1) dispersion map. Panels C and D: slices at angles of 2° and 72°, covering most of the gas emission and the major axes of the inner disk, respectively. Superimposed on these slices are the velocity projections of models A and B. Model C is omitted to avoid clutter, as its projected velocities are similar to those of the other models. The color map represents the S/N. Panels E and F: position velocity slices along the PAs of 147° and 170° where we observe the maximum gas dispersion. Embedded in these slits are also the velocity projections of models A, B, and C.
Current usage metrics show cumulative count of Article Views (full-text article views including HTML views, PDF and ePub downloads, according to the available data) and Abstracts Views on Vision4Press platform.
Data correspond to usage on the plateform after 2015. The current usage metrics is available 48-96 hours after online publication and is updated daily on week days.
Initial download of the metrics may take a while.