Open Access
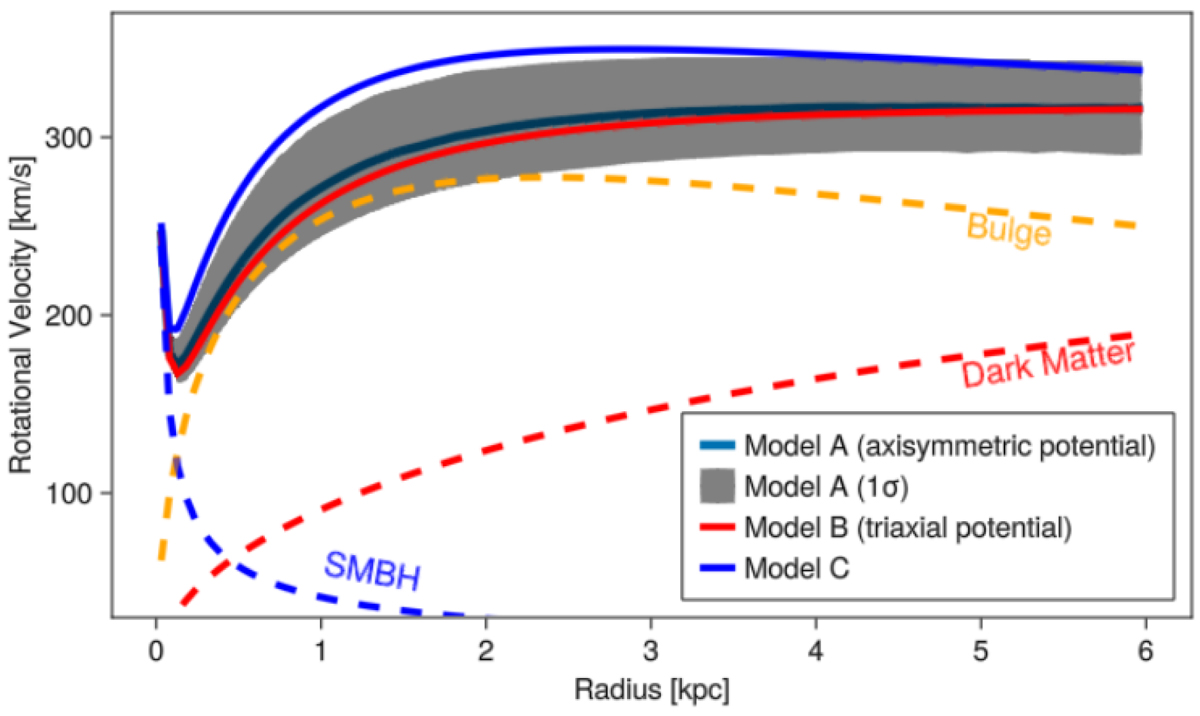
Fig. 6.
Download original image
Rotational velocity. The black line represents the best solution of the axisymmetric model, red the triaxial, and blue the generic interpolating model. The gray band represents the 1σ confidence level of the parameters’ posterior distribution regarding the axisymmetric model.
Current usage metrics show cumulative count of Article Views (full-text article views including HTML views, PDF and ePub downloads, according to the available data) and Abstracts Views on Vision4Press platform.
Data correspond to usage on the plateform after 2015. The current usage metrics is available 48-96 hours after online publication and is updated daily on week days.
Initial download of the metrics may take a while.