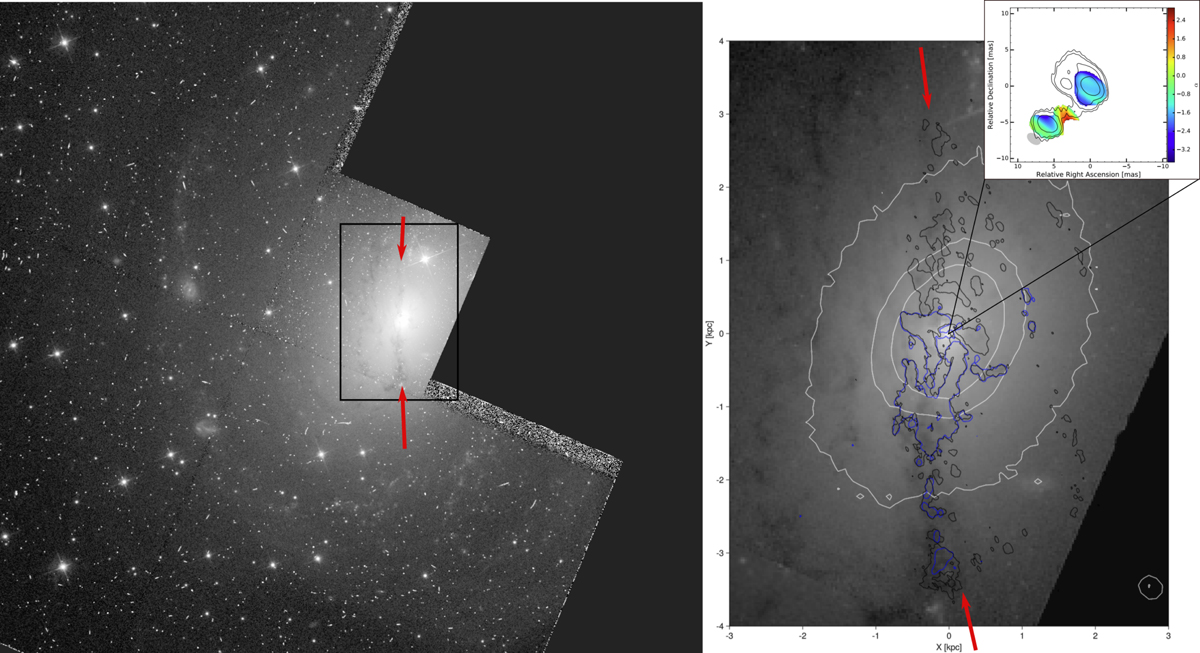
Fig. 1.
Download original image
Hubble Space Telescope (WFPC2) view of NGC6328. Left: grand-scale (∼16 kpc) image (obtained from https://commons.wikimedia.org/wiki/File:NGC6328hst05479606.png). Right: zoomed-in view of the central 4 kpc (indicated also in the black box on the left). CO(2 − 1) (black) and CO(3 − 2) (blue) 4σ contours of the maximum flux per channel. The central north-south oriented dust lane, correlated with the CO emission, is indicated with red arrows, along with a less prominent feature to the west marking the start of a faint spiral arm. The elliptical contours represent the stellar distribution from VLT in the J band. In the top right inset, we include the bipolar radio map from Angioni et al. (2019) and the spectral index between 8.4 GHz and 22.3 GHz.
Current usage metrics show cumulative count of Article Views (full-text article views including HTML views, PDF and ePub downloads, according to the available data) and Abstracts Views on Vision4Press platform.
Data correspond to usage on the plateform after 2015. The current usage metrics is available 48-96 hours after online publication and is updated daily on week days.
Initial download of the metrics may take a while.