Open Access
Fig. 3.
Download original image
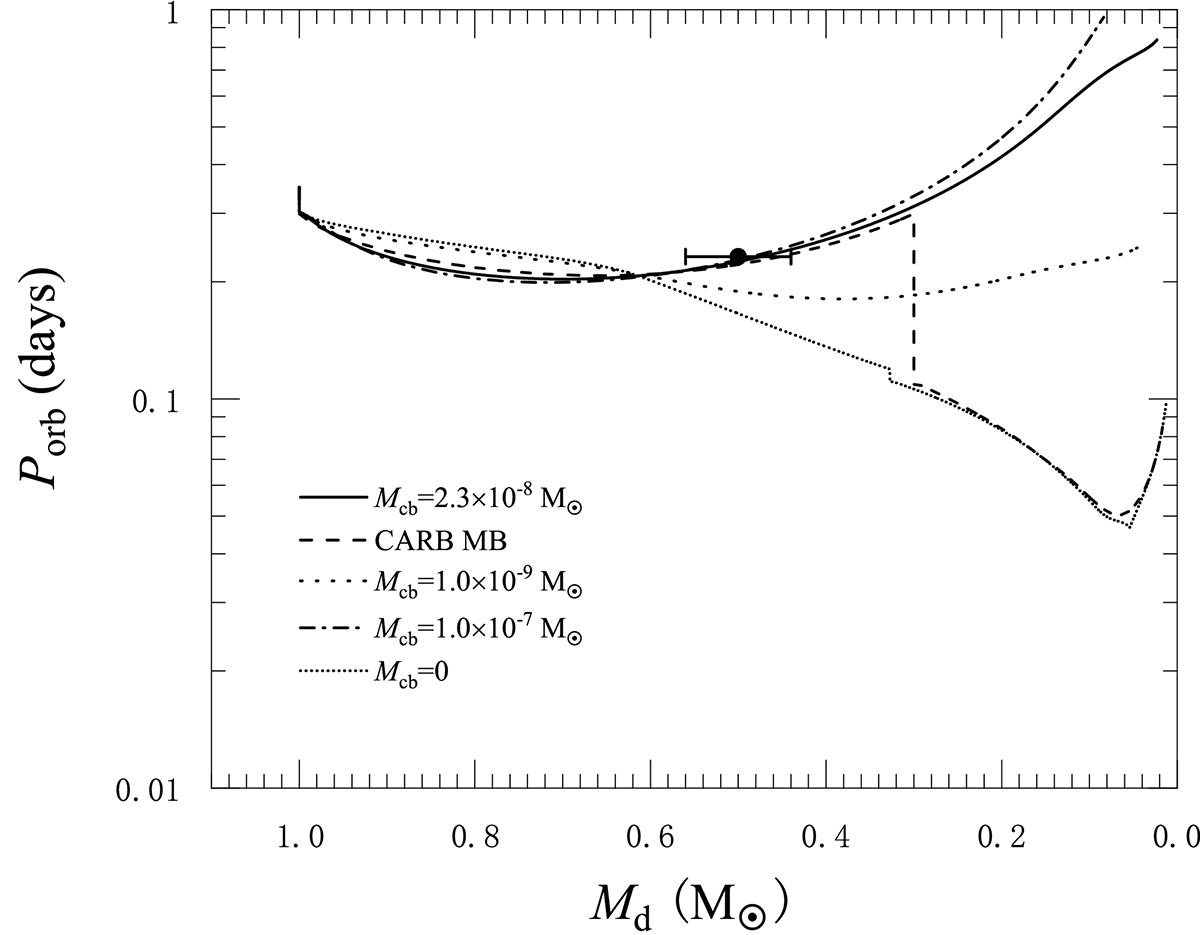
Same as in Fig. 2, but for the diagram of the orbital period vs. donor star mass. The solid circle represents the observed data for source 2A 1822-371.
Current usage metrics show cumulative count of Article Views (full-text article views including HTML views, PDF and ePub downloads, according to the available data) and Abstracts Views on Vision4Press platform.
Data correspond to usage on the plateform after 2015. The current usage metrics is available 48-96 hours after online publication and is updated daily on week days.
Initial download of the metrics may take a while.