Fig. 9
Download original image
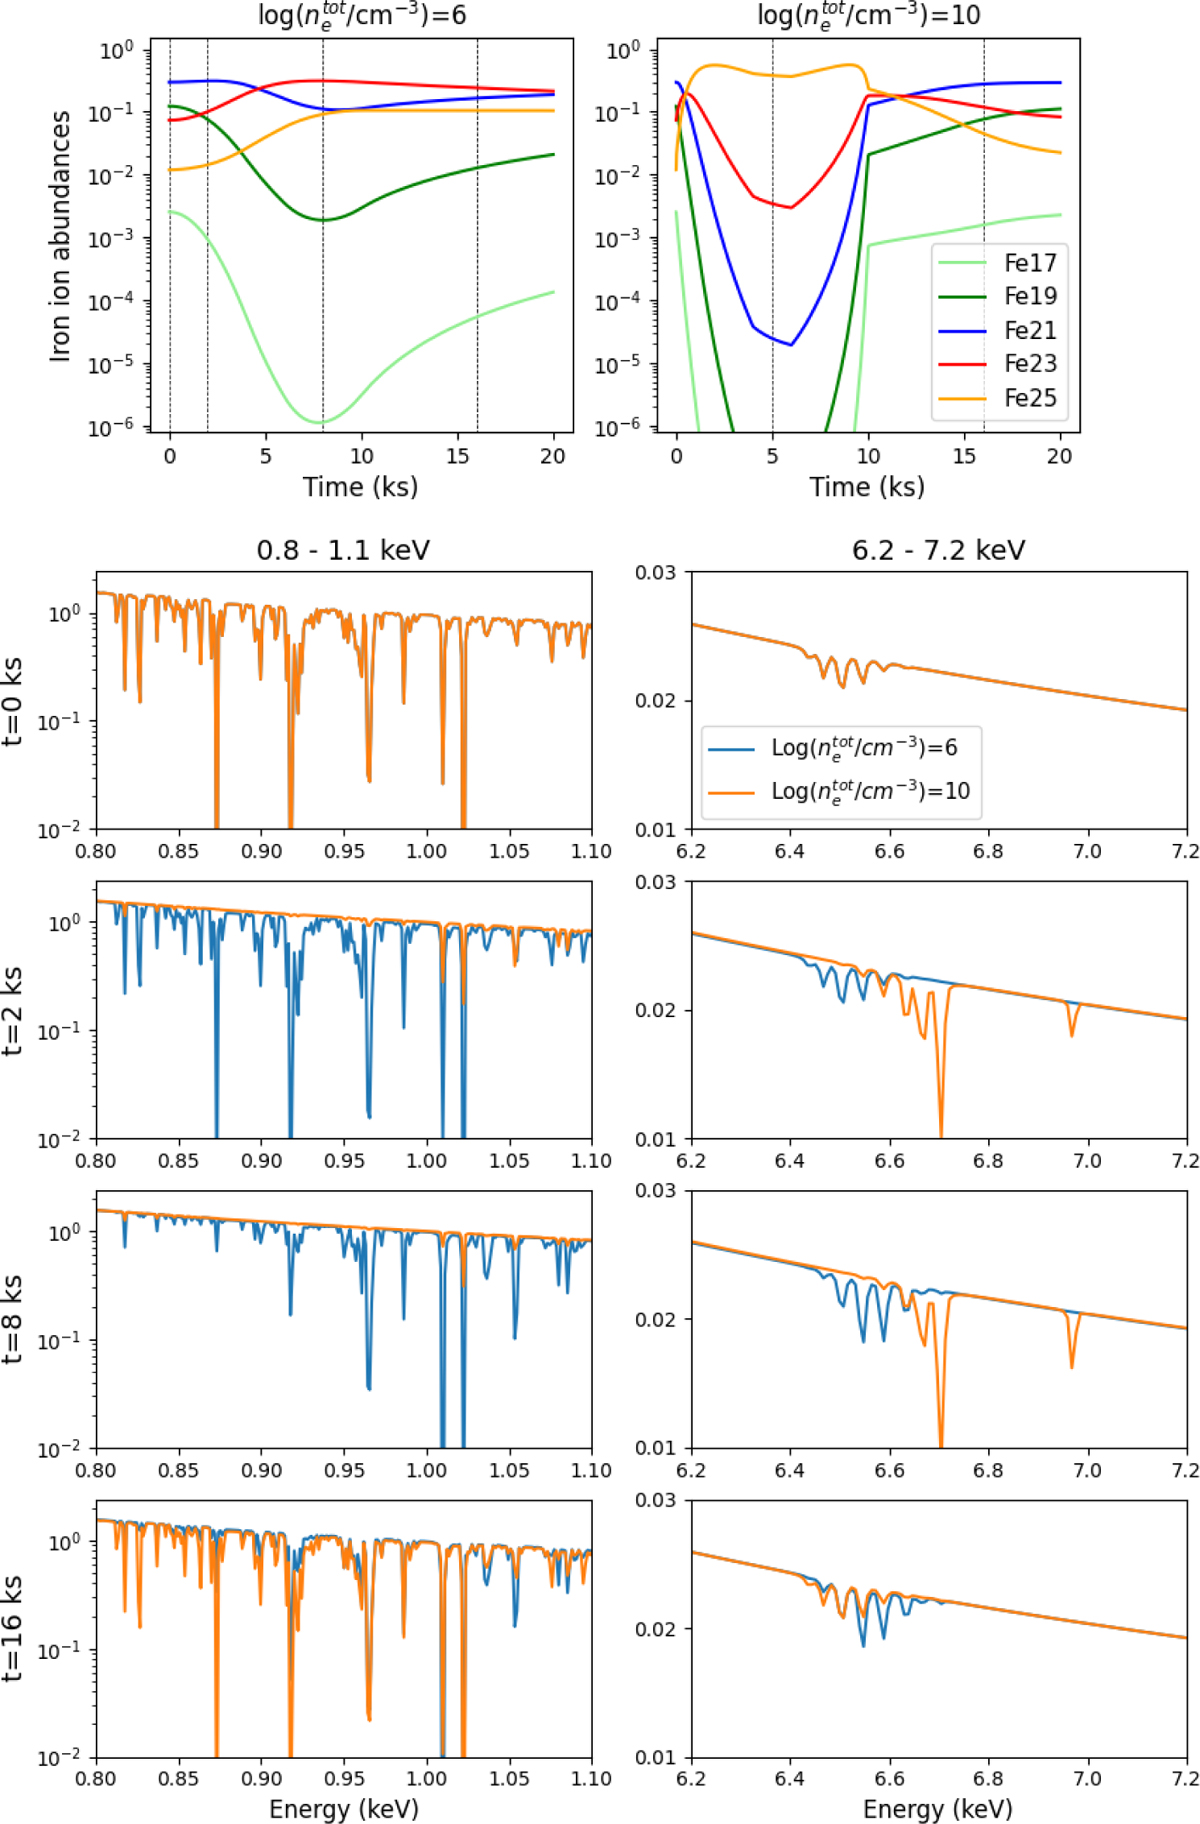
Spectra of AGN outflows. Top: selected iron ion abundances (see legend) as a function of t for log(![]() ) = 6, 10 (left and right panels). The dashed lines show the times corresponding to the spectra shown below. Bottom: absorption spectra for log(
) = 6, 10 (left and right panels). The dashed lines show the times corresponding to the spectra shown below. Bottom: absorption spectra for log(![]() ) = 22 and t = 0, 2, 8, 16 ks (top to bottom, corresponding to the times indicated above and in Fig. 8) and log(
) = 22 and t = 0, 2, 8, 16 ks (top to bottom, corresponding to the times indicated above and in Fig. 8) and log(![]() ) = 6, 10 (blue and orange lines). The left and right columns show respectively the Fe L and Fe K bands (i.e. 0.8–1.1 and 6.2–7.2 keV).
) = 6, 10 (blue and orange lines). The left and right columns show respectively the Fe L and Fe K bands (i.e. 0.8–1.1 and 6.2–7.2 keV).
Current usage metrics show cumulative count of Article Views (full-text article views including HTML views, PDF and ePub downloads, according to the available data) and Abstracts Views on Vision4Press platform.
Data correspond to usage on the plateform after 2015. The current usage metrics is available 48-96 hours after online publication and is updated daily on week days.
Initial download of the metrics may take a while.