Fig. 4
Download original image
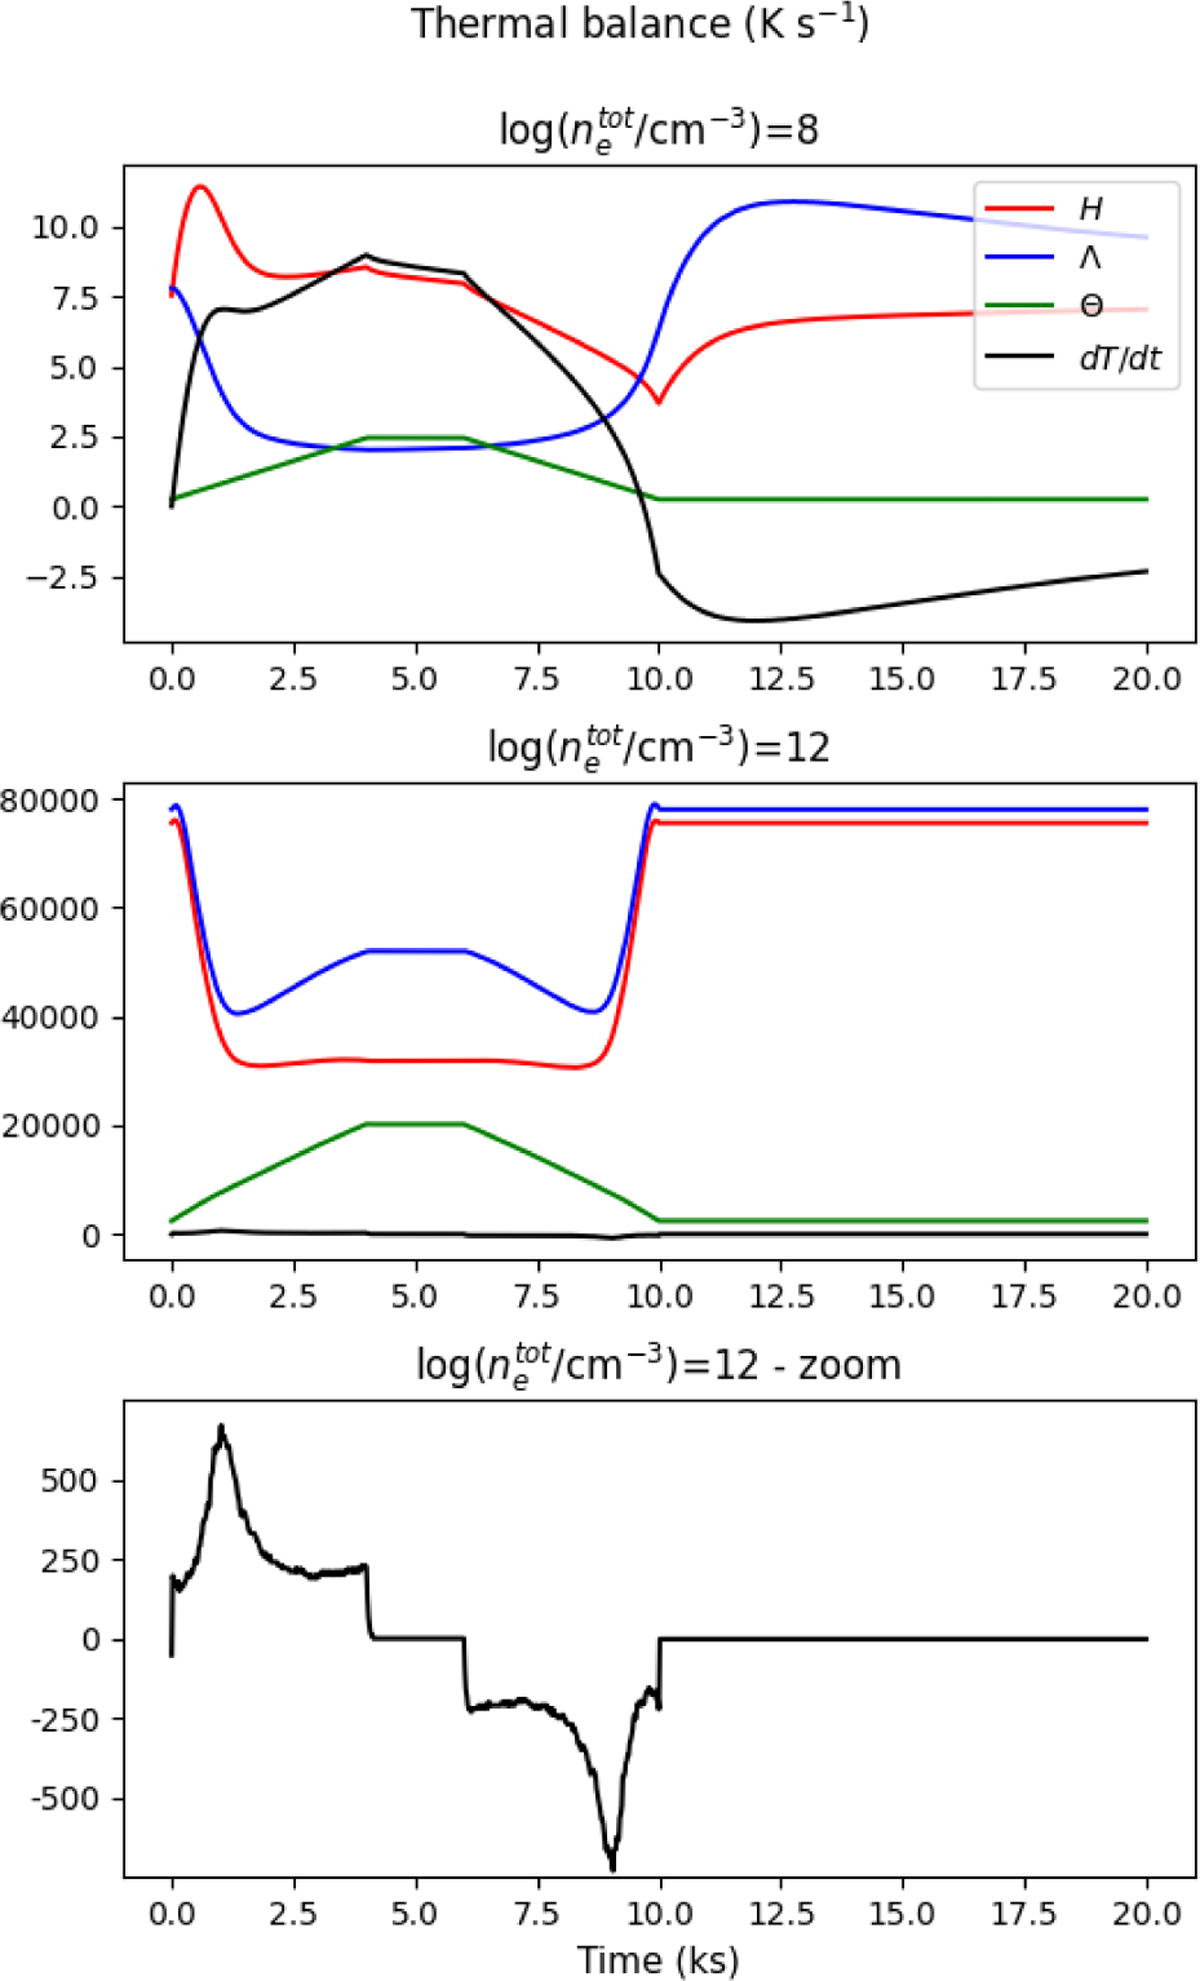
Heating H, cooling Λ, and Compton net heating Θ (red, blue, and green lines, respectively) in units of Ks−1 as a function of t. The black line represents the algebraic sum of these terms, corresponding to the time derivative of the temperature. The top and middle panels correspond to log(![]() ) = 8,12, while the bottom panel is a zoomed-in image of the temperature derivative for log(
) = 8,12, while the bottom panel is a zoomed-in image of the temperature derivative for log(![]() ) = 12.
) = 12.
Current usage metrics show cumulative count of Article Views (full-text article views including HTML views, PDF and ePub downloads, according to the available data) and Abstracts Views on Vision4Press platform.
Data correspond to usage on the plateform after 2015. The current usage metrics is available 48-96 hours after online publication and is updated daily on week days.
Initial download of the metrics may take a while.