Fig. 14
Download original image
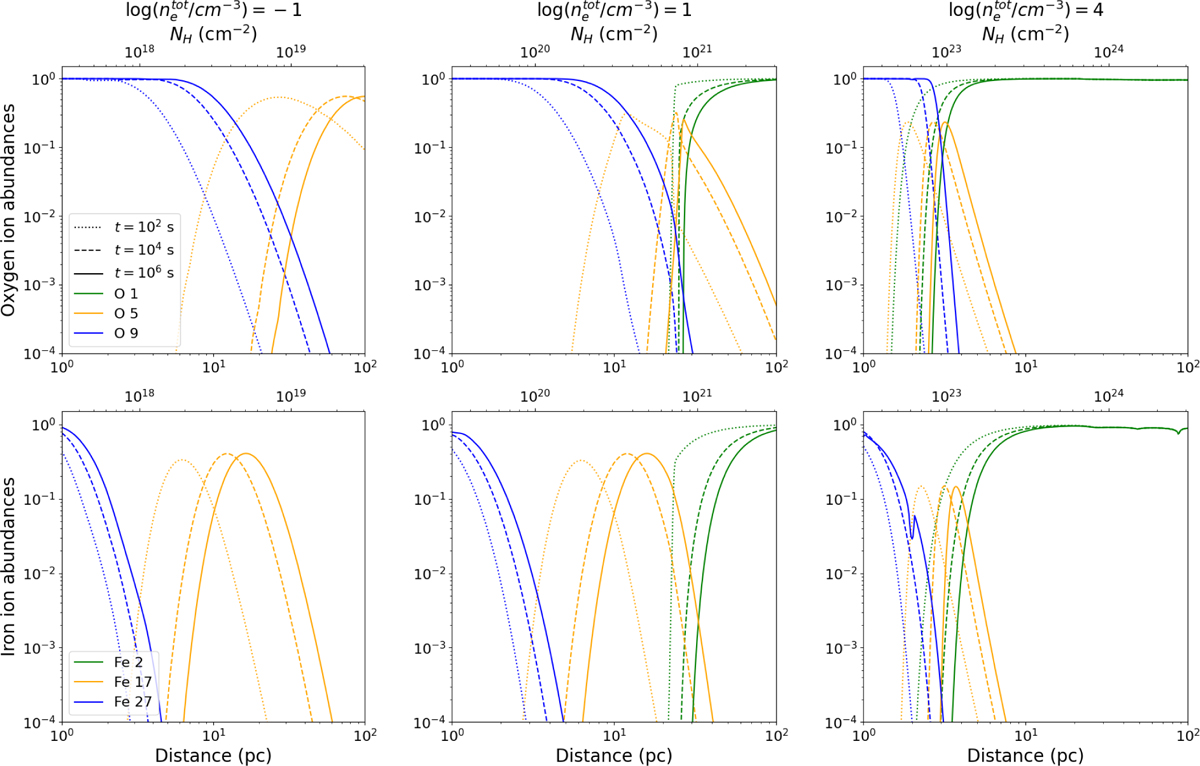
Abundances for some oxygen (top) and iron (bottom) ions (see legend for colour-coding) as a function of the radius r. The dotted, dashed and solid lines identify increasing times from the onset of the GRB, t = 102,104,106 s, respectively, while the left, middle and right panels correspond to increasing ISM density, log(![]() ) = −1, 1, 4.
) = −1, 1, 4.
Current usage metrics show cumulative count of Article Views (full-text article views including HTML views, PDF and ePub downloads, according to the available data) and Abstracts Views on Vision4Press platform.
Data correspond to usage on the plateform after 2015. The current usage metrics is available 48-96 hours after online publication and is updated daily on week days.
Initial download of the metrics may take a while.