Fig. 13
Download original image
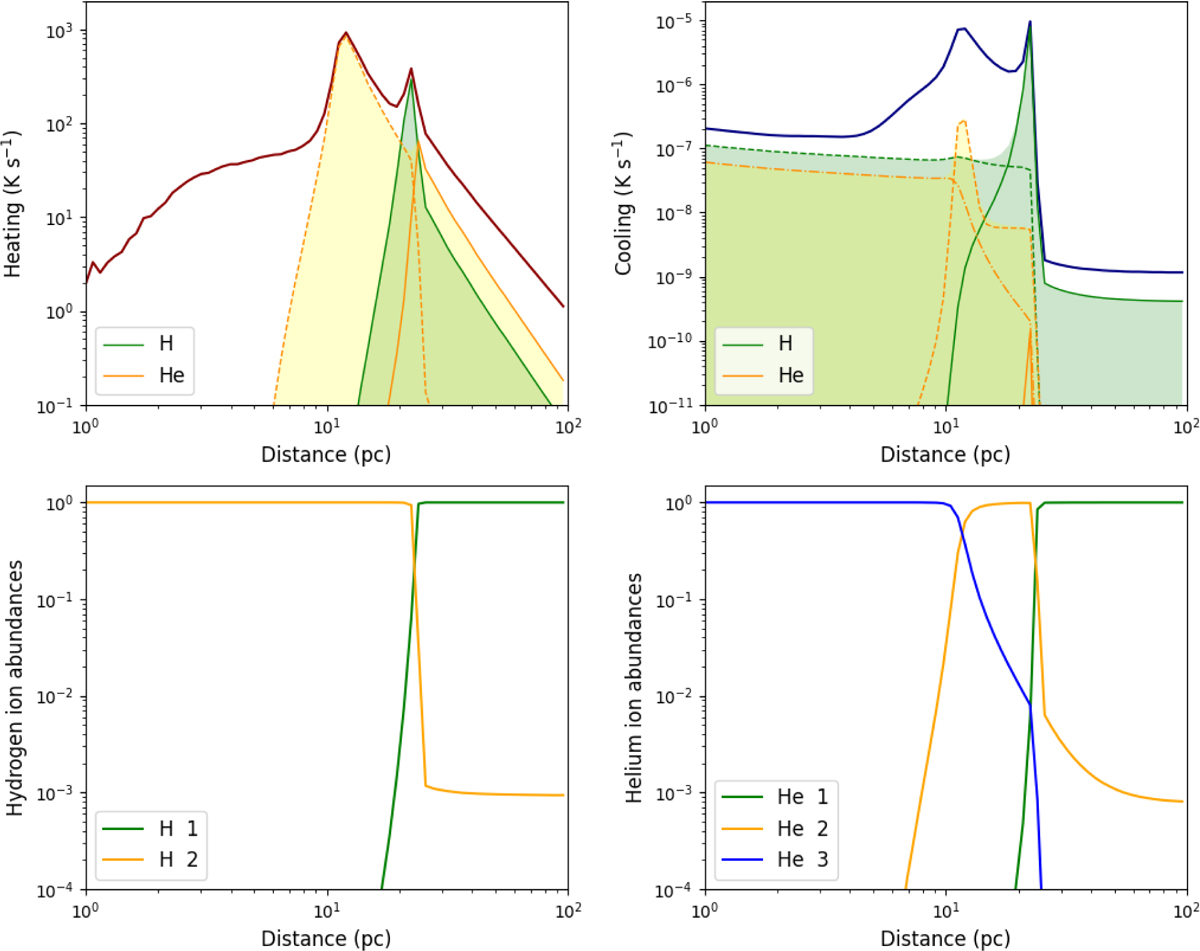
Contribution of hydrogen and helium to the total heating and cooling rates. Top panels: heating (left) and cooling (right) rates as a function of the radius r. The red line in the left panel and the blue line in the right panel correspond to the total rates, while the green and yellow shaded areas correspond to the total hydrogen and helium rates, respectively. The green(yellow) solid and dashed lines correspond to the rates of H(He) I, II, respectively, while the yellow dot-dashed line to He III. Bottom: hydrogen and helium (left and right, respectively) ion abundances (see legend for colour-coding) as a function of r. In all cases log(![]() ) = 1, t = 102 s.
) = 1, t = 102 s.
Current usage metrics show cumulative count of Article Views (full-text article views including HTML views, PDF and ePub downloads, according to the available data) and Abstracts Views on Vision4Press platform.
Data correspond to usage on the plateform after 2015. The current usage metrics is available 48-96 hours after online publication and is updated daily on week days.
Initial download of the metrics may take a while.