Open Access
Fig. 11
Download original image
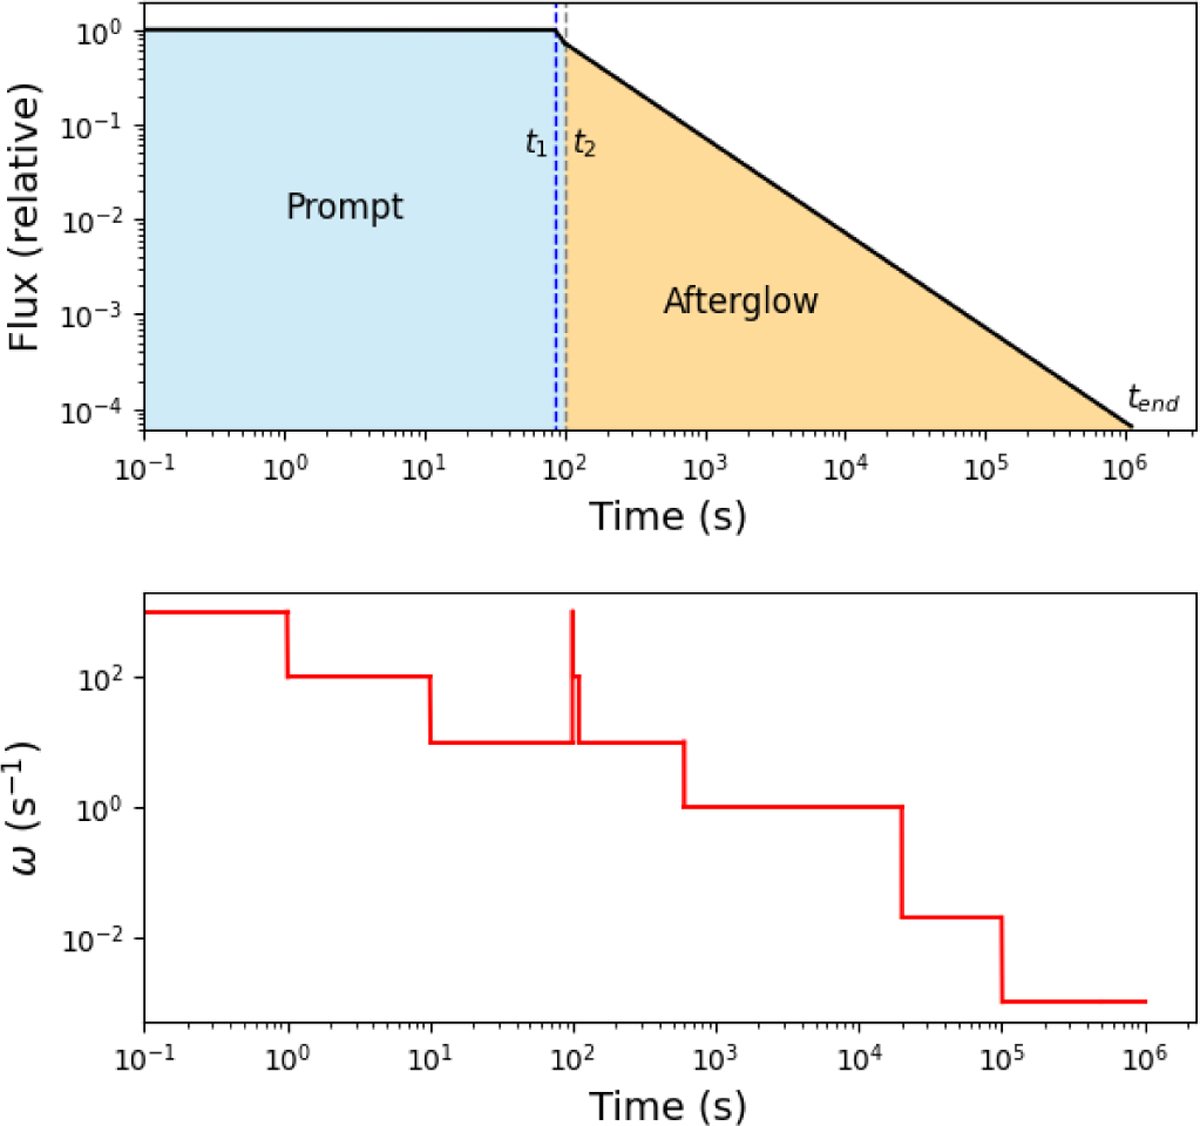
Luminosity and temporal resolution as a function of time in the GRB case. Top: GRB light curve. t1, t2, and tend correspond respectively to the end of the initial constant luminosity phase, the start of the afterglow and the end time of the simulation. Bottom: resolution ω as a function of time.
Current usage metrics show cumulative count of Article Views (full-text article views including HTML views, PDF and ePub downloads, according to the available data) and Abstracts Views on Vision4Press platform.
Data correspond to usage on the plateform after 2015. The current usage metrics is available 48-96 hours after online publication and is updated daily on week days.
Initial download of the metrics may take a while.