Open Access
Fig. 1
Download original image
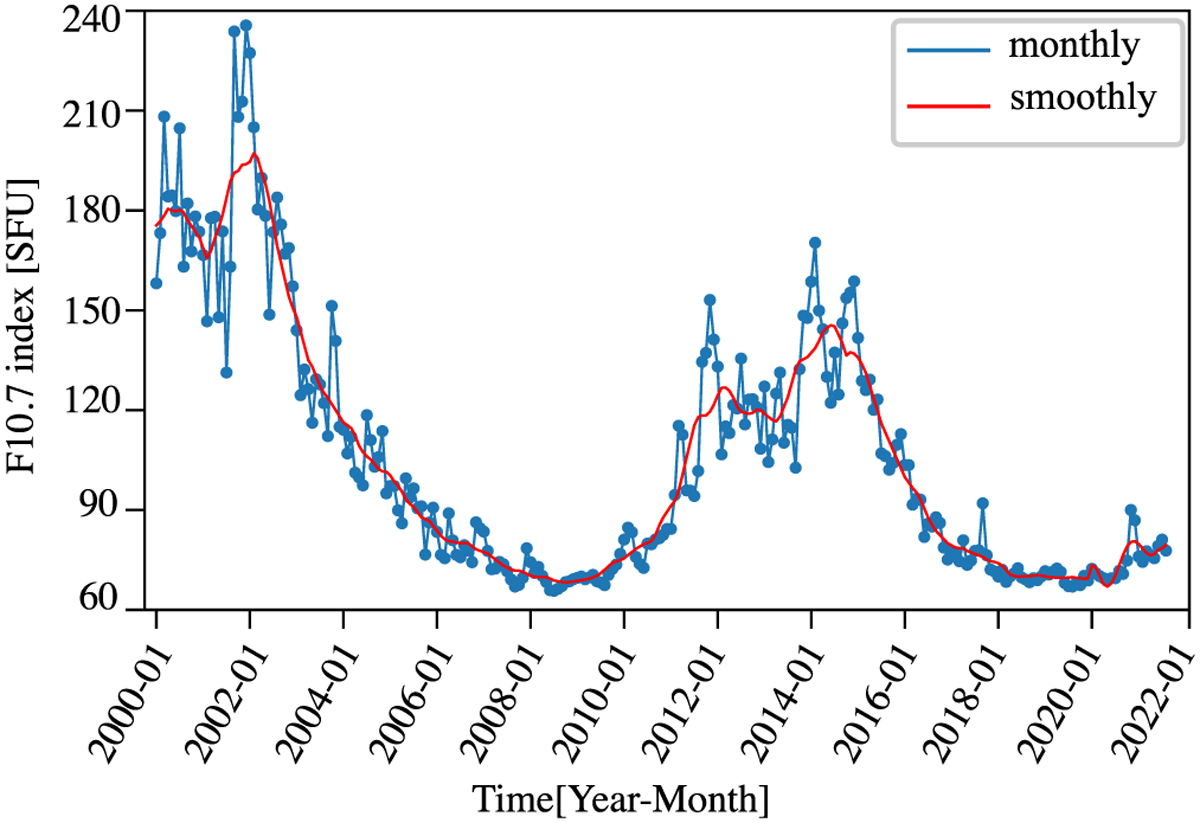
Annual variation of 10.7 cm solar radio flux (F10.7) index. The blue curve is the average of the F10.7 index one month; the curve is the smooth data of F10.7 index, the dots are the scattered values of the monthly F10.7 index.
Current usage metrics show cumulative count of Article Views (full-text article views including HTML views, PDF and ePub downloads, according to the available data) and Abstracts Views on Vision4Press platform.
Data correspond to usage on the plateform after 2015. The current usage metrics is available 48-96 hours after online publication and is updated daily on week days.
Initial download of the metrics may take a while.