Fig. 8
Download original image
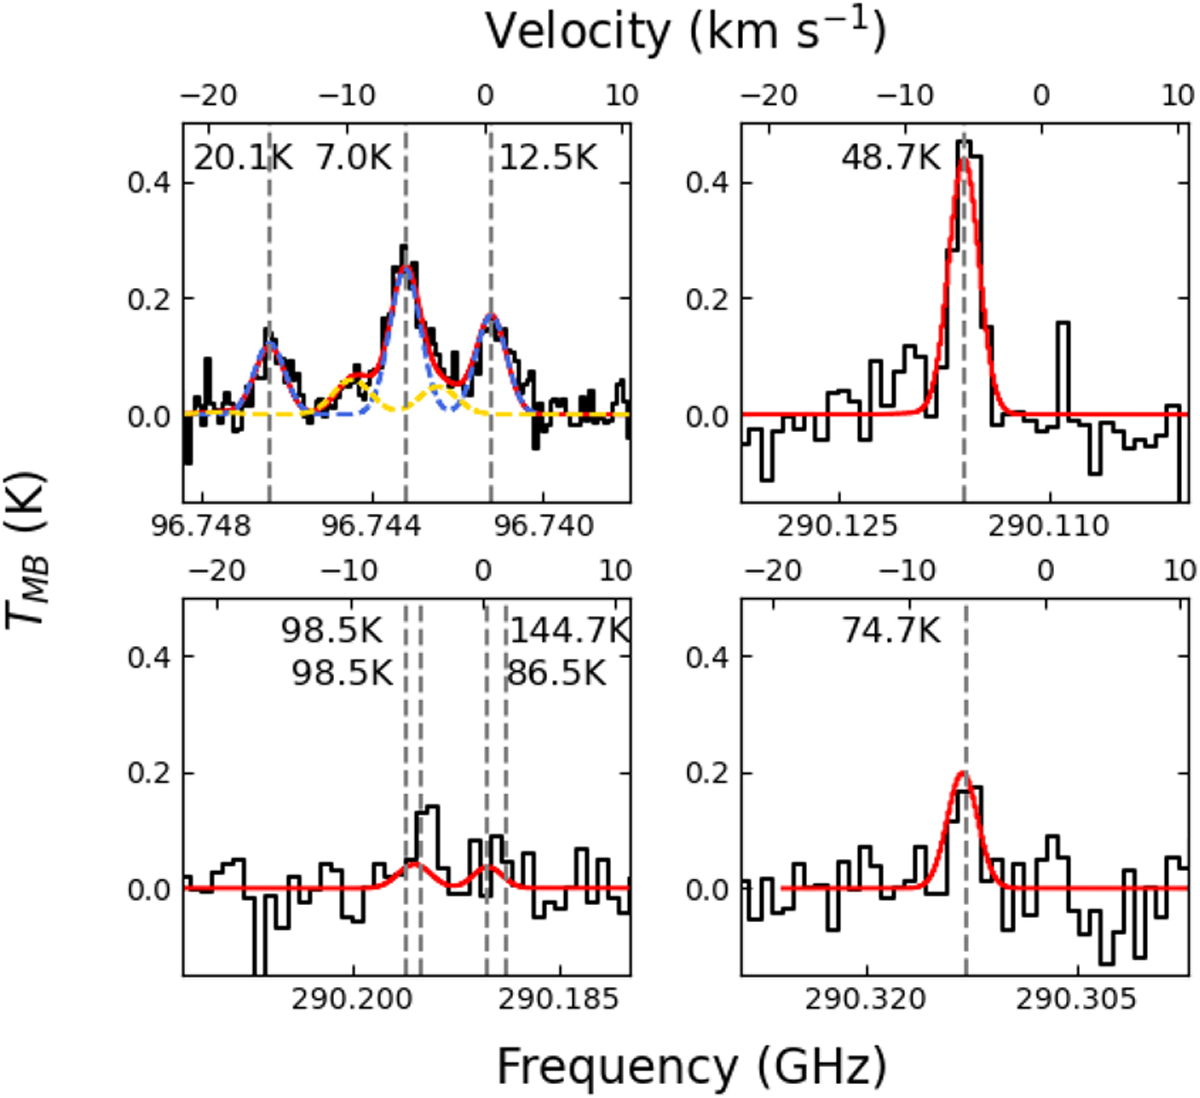
RADEX fit for CH3OH in the central pixel of AFGL 2591, corresponding to pixel 7 in Fig. 7 and Table 3. The solid red line is the overall two-component model, the solid black line is the data, the dashed blue line is component one and the dashed yellow line is component two. Component two is only seen in the lower energy lines within the GBT range, thus component one and the overall model are the same for the lines in the IRAM range. The dashed grey line represents the observed transition frequency, with the energy level of this transition labelled.
Current usage metrics show cumulative count of Article Views (full-text article views including HTML views, PDF and ePub downloads, according to the available data) and Abstracts Views on Vision4Press platform.
Data correspond to usage on the plateform after 2015. The current usage metrics is available 48-96 hours after online publication and is updated daily on week days.
Initial download of the metrics may take a while.