Fig. 9.
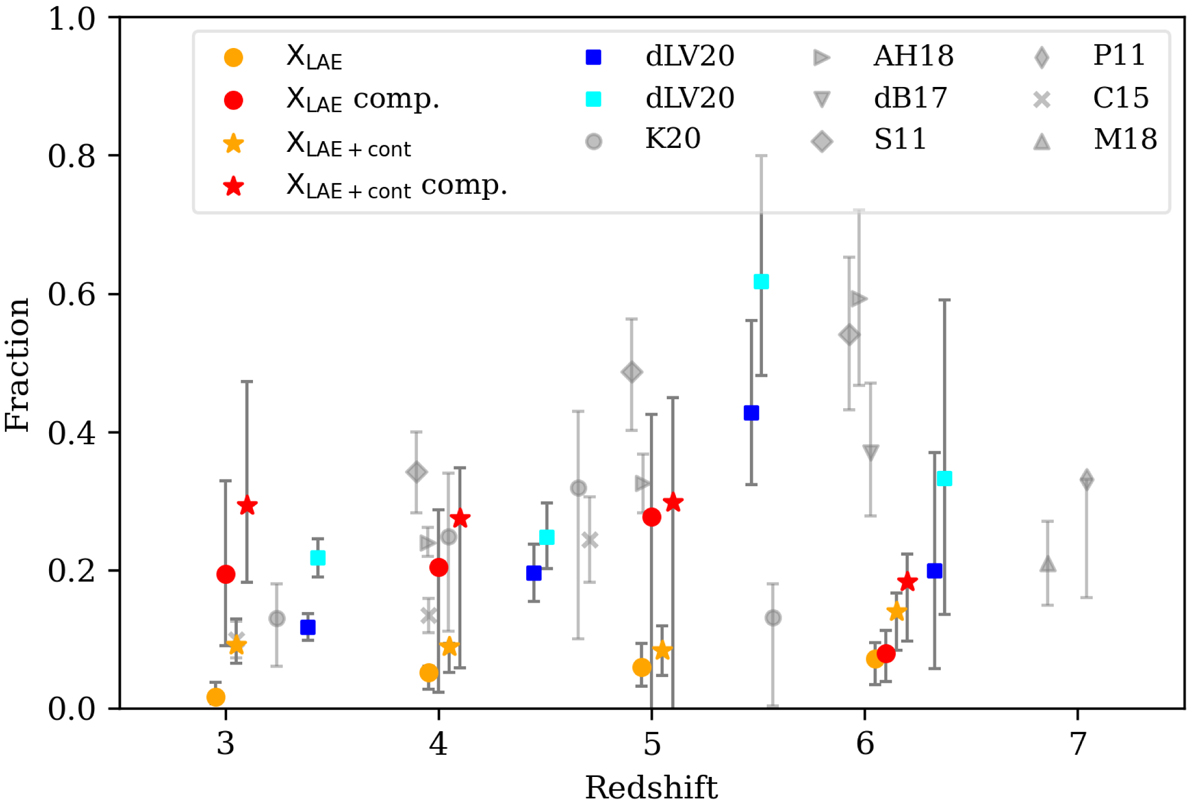
Download original image
LAE fraction, XLAE, over a redshift range of 2.9–6.7, using the typical literature limits of EWLyα > 25 Å and M1500 > −20.25. The coloured circles represent XLAE when just LAE+LBG objects are taken into consideration, and the coloured stars represent the same calculation but including the LAE+continuum sample (see Sect. 2.4). Coloured stars indicate these XLAE values including the completeness correction for the number of LAEs (see Sect. 2.5). Blue and cyan squares represent the results from dLV20, with cyan representing those with the completeness correction. Shorthand is used in the legend for the literature results, but we give the full list here (in the same order as the legend): Kusakabe et al. (2020), Arrabal Haro et al. (2018), De Barros et al. (2017), Stark et al. (2011), Pentericci et al. (2011), Cassata et al. (2015), and Mason et al. (2018b). A small redshift offset is artificially applied to some points for clarity.
Current usage metrics show cumulative count of Article Views (full-text article views including HTML views, PDF and ePub downloads, according to the available data) and Abstracts Views on Vision4Press platform.
Data correspond to usage on the plateform after 2015. The current usage metrics is available 48-96 hours after online publication and is updated daily on week days.
Initial download of the metrics may take a while.