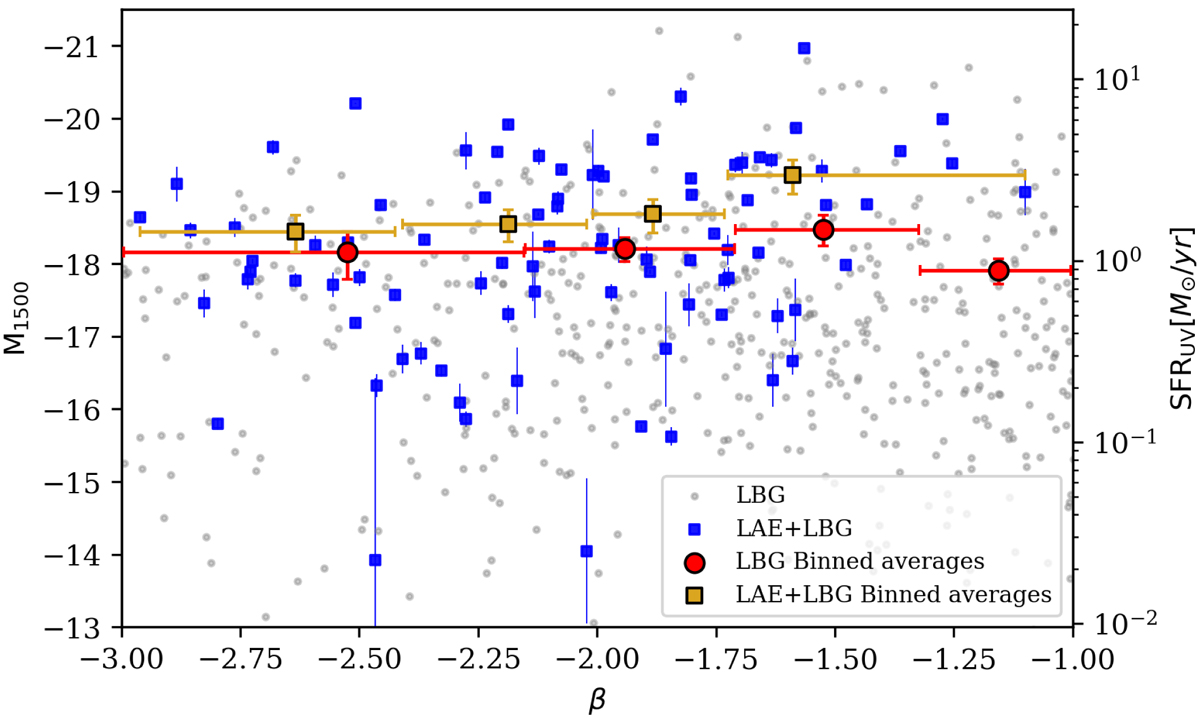
Fig. 7.

Download original image
M1500 and SFRUV vs. UV slope. The sample selected as LBG-only is shown in grey, and the LAE+LBG sample is colour-coded by redshift. Binned averages in SFRUV for the LBG and LAE+LBG samples are shown with red circles and golden squares, respectively. Each bin contains an equal number of the respective samples, and the horizontal error bars show the width (in terms of β) of each bin. Errors on the LBG-only objects are omitted for readability, and we note that there are LBG-only objects (and four LAE+LBG objects; see Fig. 5) that extend beyond the β limits of this graph; however, they are objects for which the calculation of the UV slope is uncertain. There are LBG-only objects that extend beyond the M1500 limits of the graph, but these are taken into account when computing the binned averages.
Current usage metrics show cumulative count of Article Views (full-text article views including HTML views, PDF and ePub downloads, according to the available data) and Abstracts Views on Vision4Press platform.
Data correspond to usage on the plateform after 2015. The current usage metrics is available 48-96 hours after online publication and is updated daily on week days.
Initial download of the metrics may take a while.


