Fig. 5.
Download original image
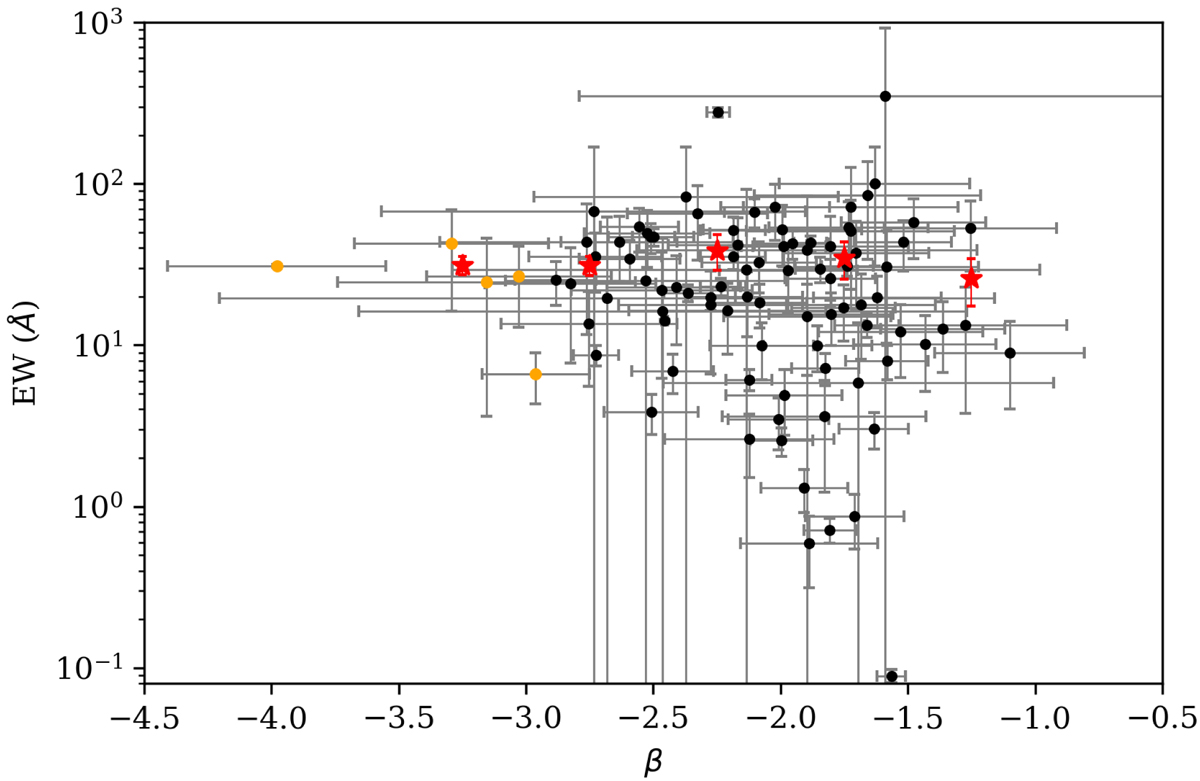
UV slope plotted against EWLyα for the LAE+LBG sample. Orange dots represent UV slopes that, upon inspection, we find to be dubious: photometry that locally does not represent the slope well or has large errors. Red stars represent average values in equally sized bins between β = −3.5 and β = −1.0. The change in EWLyα across this range is not as significant as the change across the range of probed UV magnitudes (see Fig. 4); however, we see a lightly rising trend in EWLyα with bluer slopes down to β = −2.5.
Current usage metrics show cumulative count of Article Views (full-text article views including HTML views, PDF and ePub downloads, according to the available data) and Abstracts Views on Vision4Press platform.
Data correspond to usage on the plateform after 2015. The current usage metrics is available 48-96 hours after online publication and is updated daily on week days.
Initial download of the metrics may take a while.