Fig. 4.
Download original image
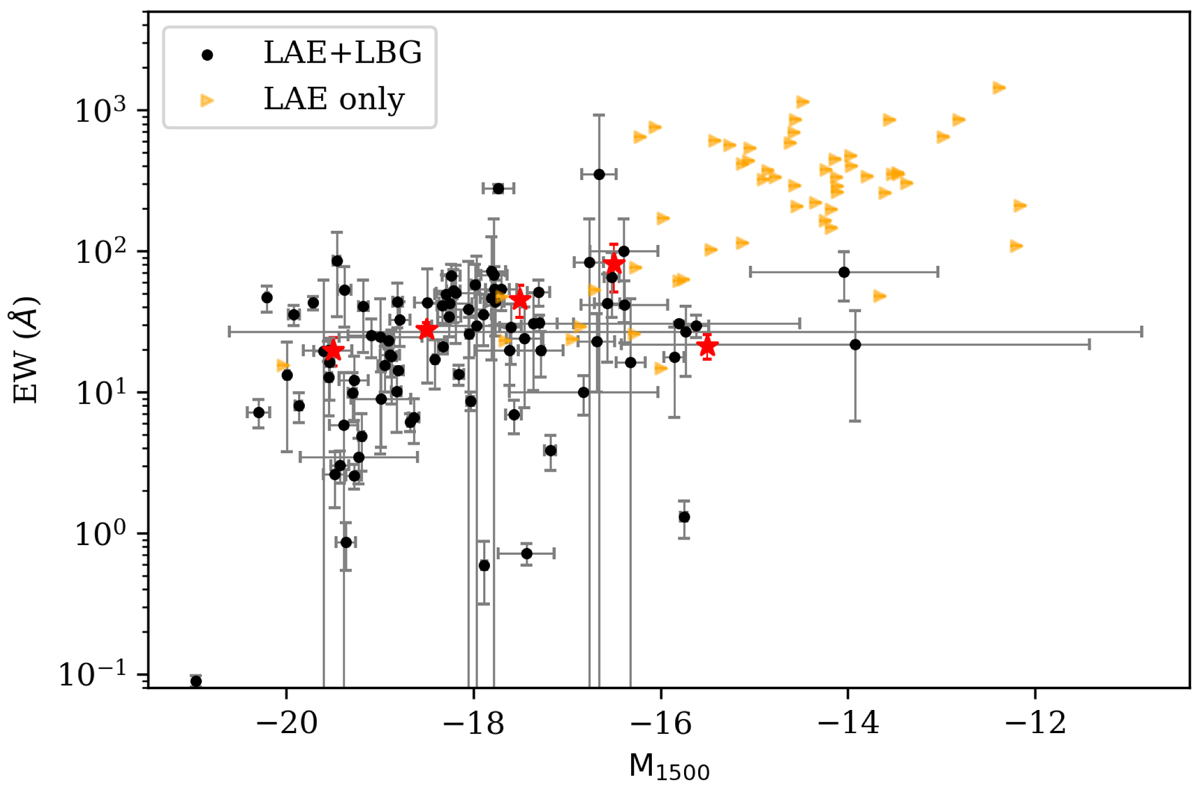
EWLyα distribution over the range of UV absolute magnitude probed for the LAE+LBG sample. The red stars indicate the average in five equal-size bins between M1500 = −20 and M1500 = −15, the region that is well populated. De Barros et al. (2017) provide a similar plot (at z = 6) for a brighter sample with a similar rising average EWLyα. Our plot extends several magnitudes fainter, and we see that this trend continues down to at least M1500 = −16. An idea of the region fainter than M1500 = −15 can be gained by including the LAE-only sample (orange triangles), the vast majority of which are very faint in UV magnitude, and high-EWLyα objects. For these objects, EW error bars, coming only from the error on the Lyman-α flux, are smaller than the size of the points. The continuum values used are 2σ upper limits estimated from the filter that would see the emission at 1500 Å rest frame.
Current usage metrics show cumulative count of Article Views (full-text article views including HTML views, PDF and ePub downloads, according to the available data) and Abstracts Views on Vision4Press platform.
Data correspond to usage on the plateform after 2015. The current usage metrics is available 48-96 hours after online publication and is updated daily on week days.
Initial download of the metrics may take a while.