Fig. 3.
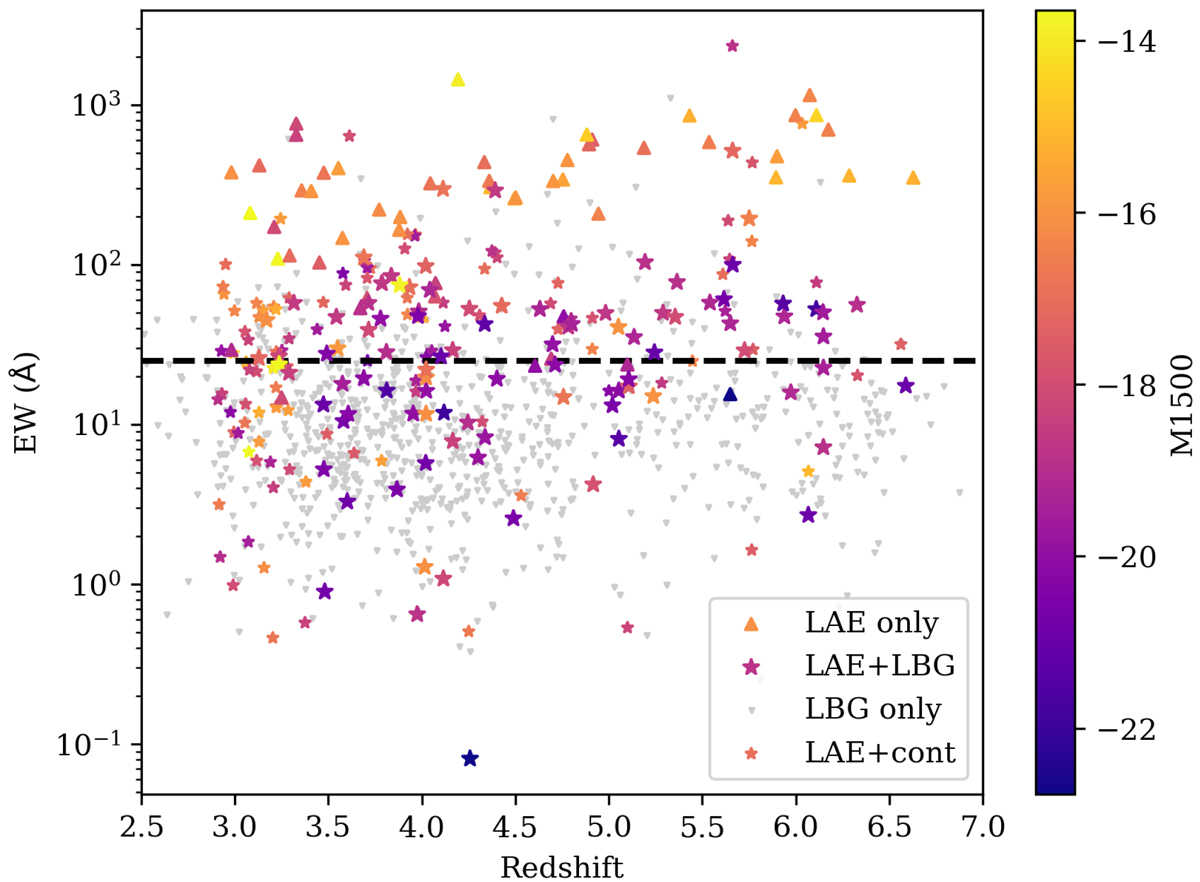
Download original image
Lyman-α EW (EWLyα) distribution for all our samples. Objects selected as LAEs or LBGs are denoted by larger stars, LAE+continuum by smaller stars, LAE-only by upward pointing triangles, and LBG-only by downward pointing triangles. EWLyα values for the latter two populations are calculated using the upper limits of the continuum and Lyman-α flux, respectively. The objects are colour-coded by M1500. The horizontal dashed line demarcates the 25 Å level, above which LAEs are included in the calculation of the LAE fraction. Error bars are omitted for clarity, but shown in Figs. 4 and 5.
Current usage metrics show cumulative count of Article Views (full-text article views including HTML views, PDF and ePub downloads, according to the available data) and Abstracts Views on Vision4Press platform.
Data correspond to usage on the plateform after 2015. The current usage metrics is available 48-96 hours after online publication and is updated daily on week days.
Initial download of the metrics may take a while.