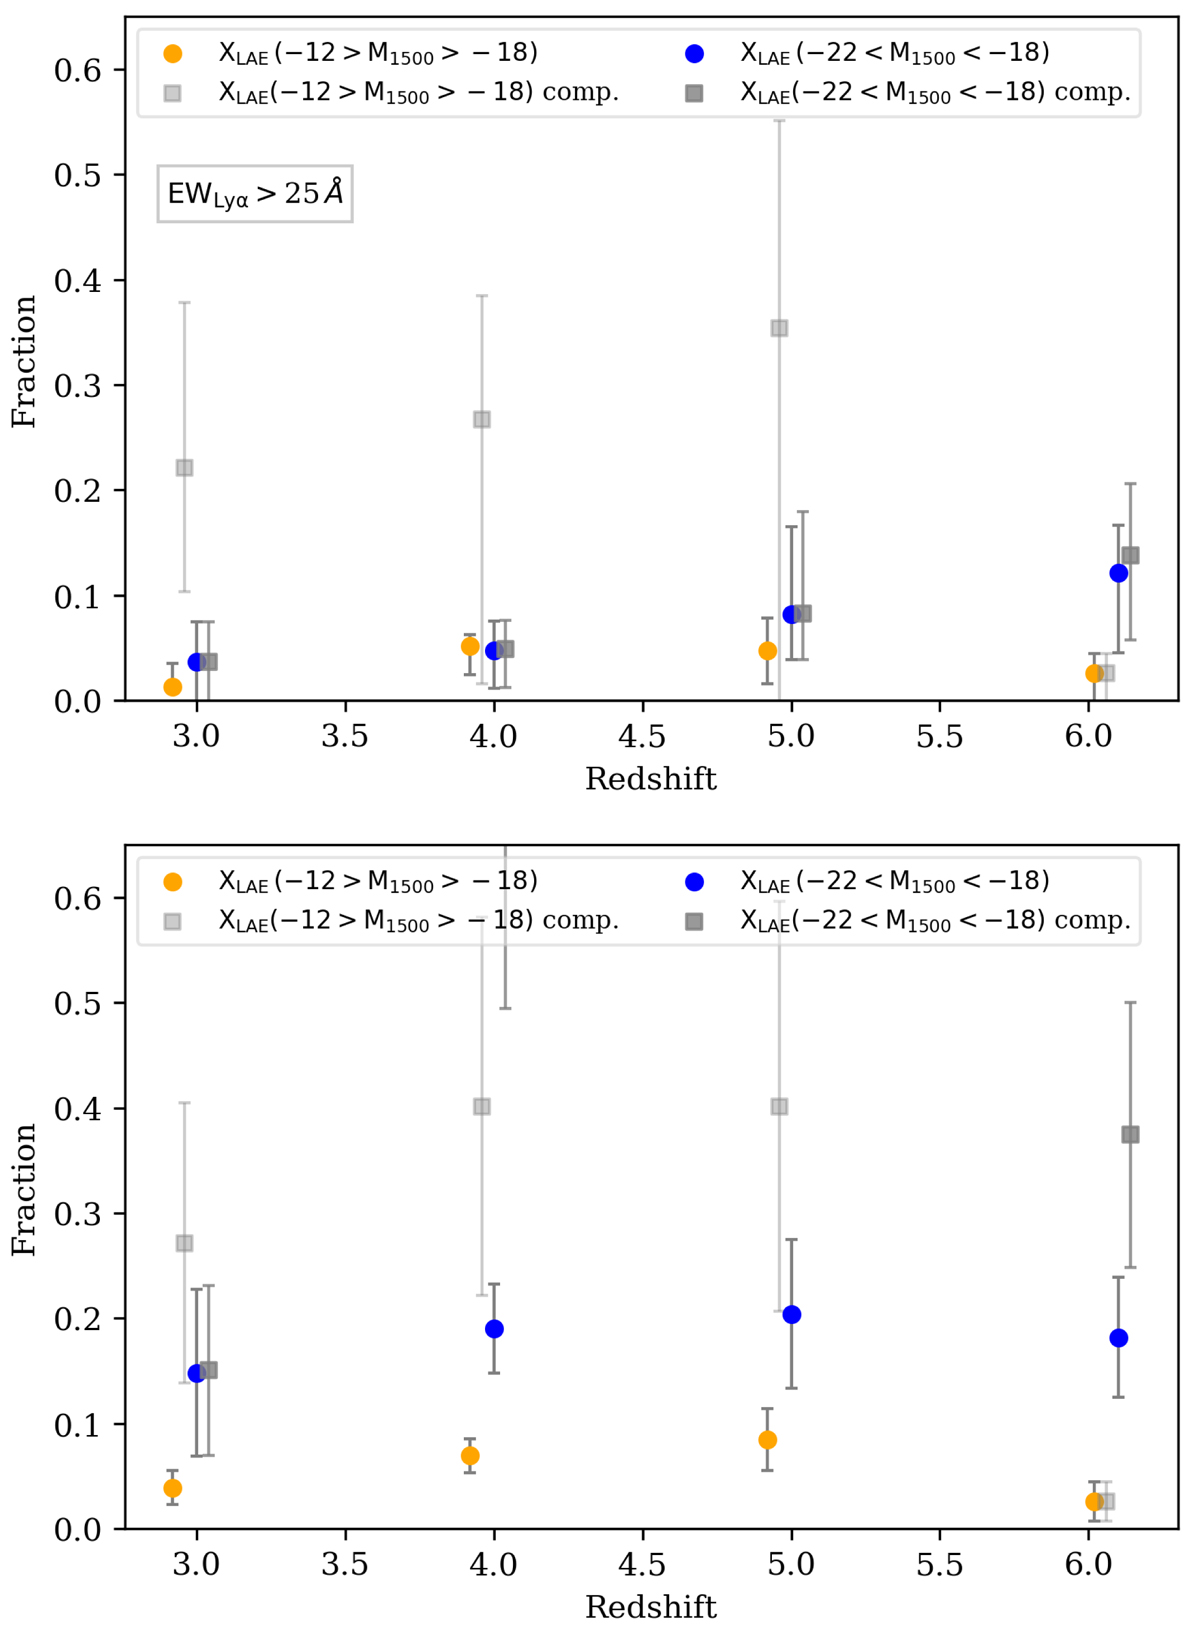
Fig. 10.
Download original image
Redshift evolution of XLAE in the bright and faint populations, split at M1500 = −18. The bright and faint populations are shown in blue and orange, and the completeness corrections in grey scale with the bright population in darker grey. The top panel corresponds to LAEs with EWLyα > 25 Å, while the lower panel shows the results when this limit is removed. The absence of the EW limit leads to a clearer separation between the two populations, suggesting that UV-bright LBGs exhibit a larger fraction of objects with Lyman-α emission when objects with small values of EWLyα are taken into account. In the lower panel the UV-bright completeness-corrected point at z ∼ 5, omitted from the plot, is at 1.19 (see the main text).
Current usage metrics show cumulative count of Article Views (full-text article views including HTML views, PDF and ePub downloads, according to the available data) and Abstracts Views on Vision4Press platform.
Data correspond to usage on the plateform after 2015. The current usage metrics is available 48-96 hours after online publication and is updated daily on week days.
Initial download of the metrics may take a while.