Fig. 2
Download original image
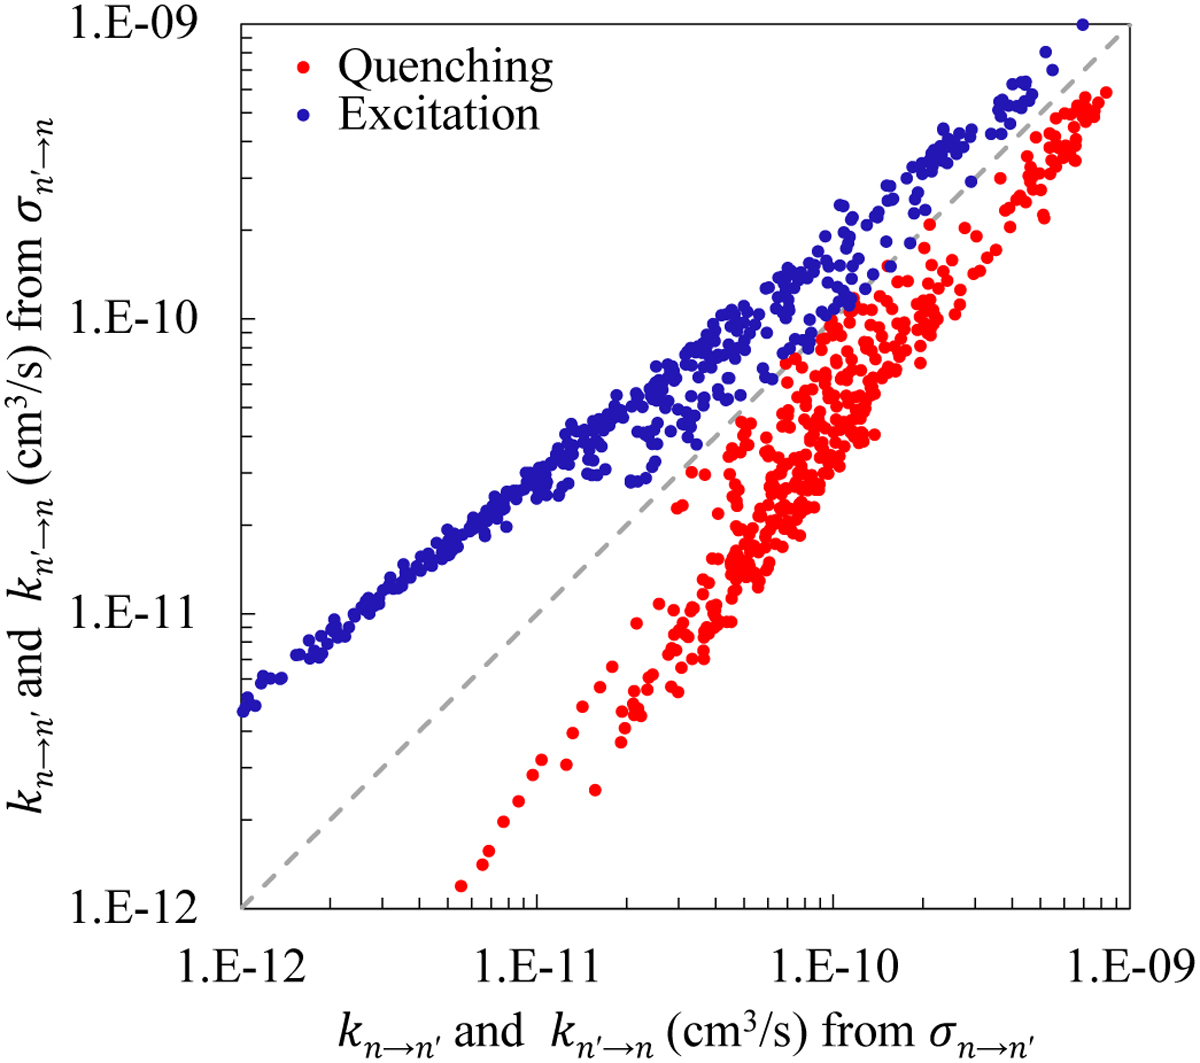
Comparison of two sets of rate coefficients obtained from quenching and excitation cross sections, as explained in the text. The departure of the datapoints from the diagonal line signifies deviation from the principle of microscopic reversibility. Red and blue correspond to quenching and excitation rate coefficients, respectively.
Current usage metrics show cumulative count of Article Views (full-text article views including HTML views, PDF and ePub downloads, according to the available data) and Abstracts Views on Vision4Press platform.
Data correspond to usage on the plateform after 2015. The current usage metrics is available 48-96 hours after online publication and is updated daily on week days.
Initial download of the metrics may take a while.