Fig. 5.
Download original image
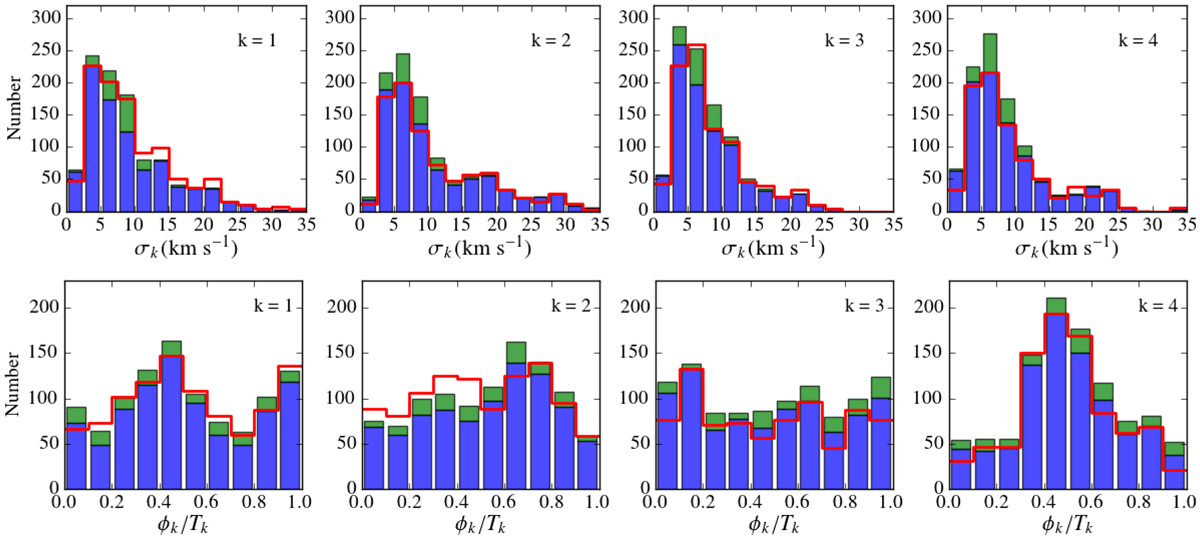
Results of the FFT measurements of the H I velocity dispersion maps. The histograms show the number of rings as a function of amplitude (top row) and normalised phase angle (bottom row) of the FFT harmonics of the THINGS sample (883 rings, in blue), the interpolated distribution with 20 rings per galaxy for THINGS (280 rings, in red, normalised to the maximum values of the blue histograms), and the WHISP sample (144 rings, in green). Phase angles are normalised to the period Tk of each order.
Current usage metrics show cumulative count of Article Views (full-text article views including HTML views, PDF and ePub downloads, according to the available data) and Abstracts Views on Vision4Press platform.
Data correspond to usage on the plateform after 2015. The current usage metrics is available 48-96 hours after online publication and is updated daily on week days.
Initial download of the metrics may take a while.