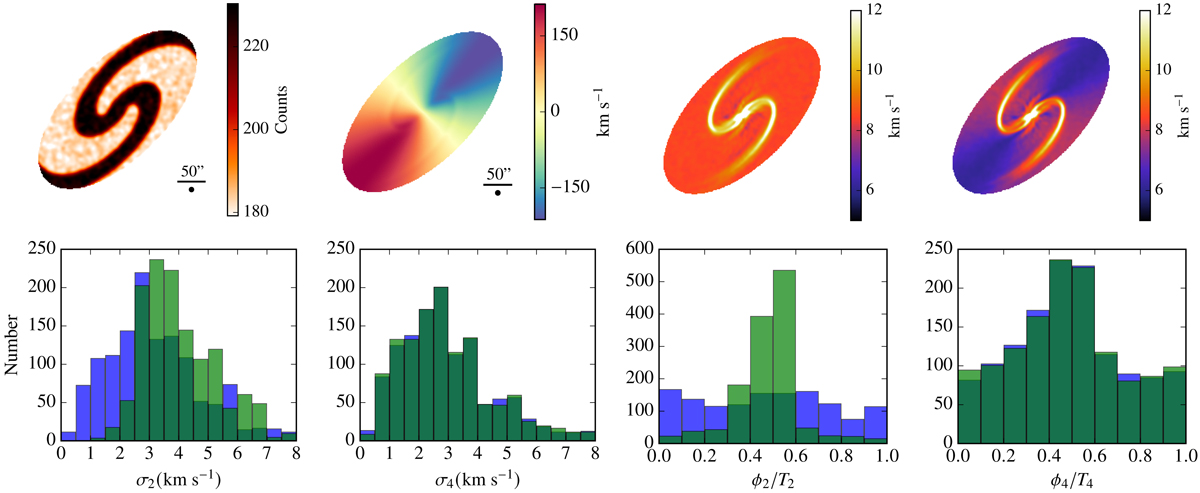
Fig. 3.
Download original image
Maps and histograms of toy models with a steep rotation curve (v0 = 250 km s−1, rs = 20″ and γ = 2) with a spiral perturbation. We show (top), from left to right, the density map, the velocity field, and the BS corrected dispersion maps in the isotropic and anisotropic cases, obtained with an inclination of 60° and with ϕsp = 135°. The bottom panels show amplitude and phase histograms of orders k = 2 and k = 4. Blue and green histograms correspond to the cases with local uniform isotropy with large-scale asymmetries, and local uniform anisotropy with large-scale asymmetries, respectively.
Current usage metrics show cumulative count of Article Views (full-text article views including HTML views, PDF and ePub downloads, according to the available data) and Abstracts Views on Vision4Press platform.
Data correspond to usage on the plateform after 2015. The current usage metrics is available 48-96 hours after online publication and is updated daily on week days.
Initial download of the metrics may take a while.