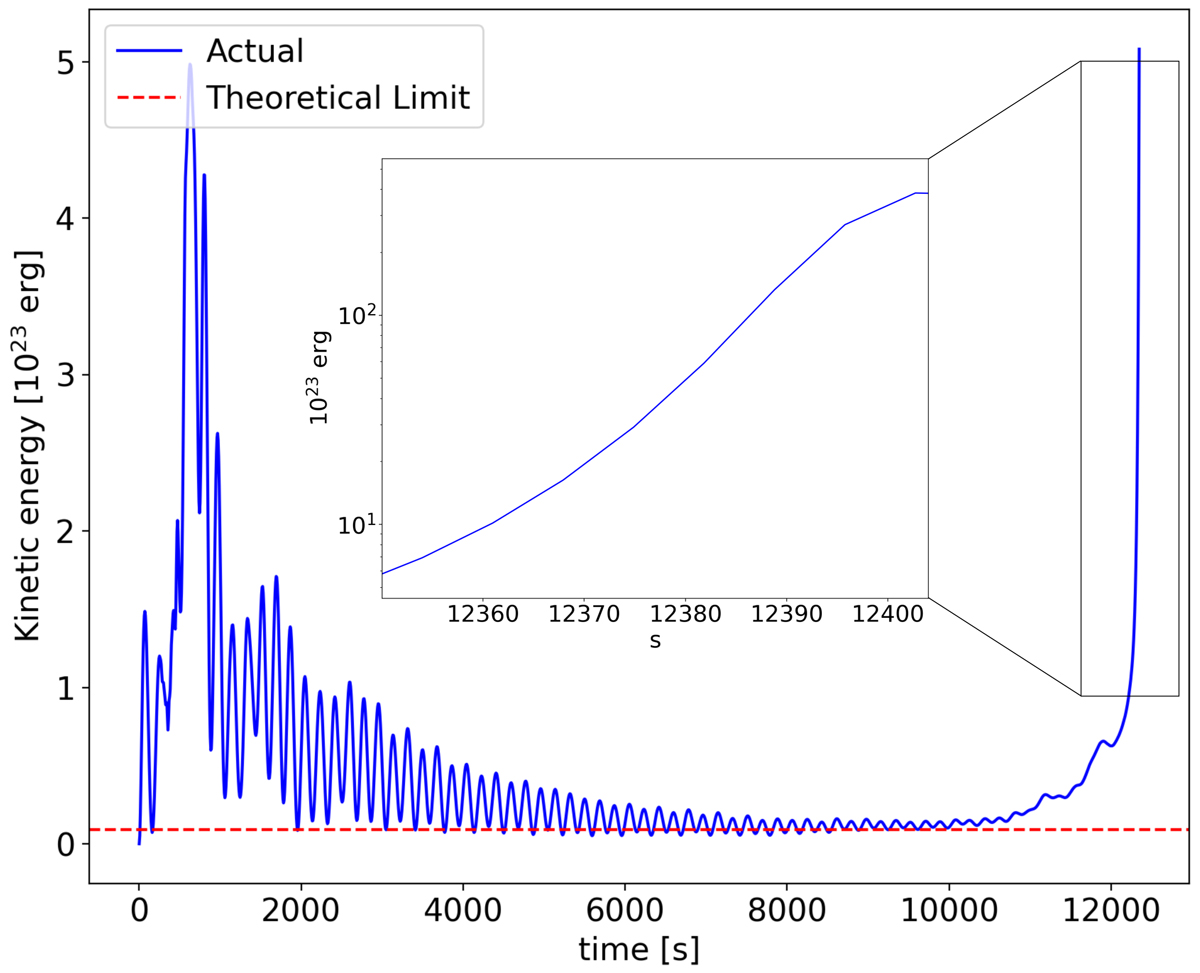
Fig. 4.
Download original image
Kinetic energy damping before the instability onset. In blue is the total kinetic energy, plotted as a function of time, in the time leading up to the instability. The last exponential rise shows the time at which the first thread is disrupted. In dashed red is a theoretical estimation of the steady state based on the model described in Eq. (27). As waves are progressively damped, the total kinetic energy is expected to tend towards this theoretical steady state prior to the instability.
Current usage metrics show cumulative count of Article Views (full-text article views including HTML views, PDF and ePub downloads, according to the available data) and Abstracts Views on Vision4Press platform.
Data correspond to usage on the plateform after 2015. The current usage metrics is available 48-96 hours after online publication and is updated daily on week days.
Initial download of the metrics may take a while.