Fig. 2.
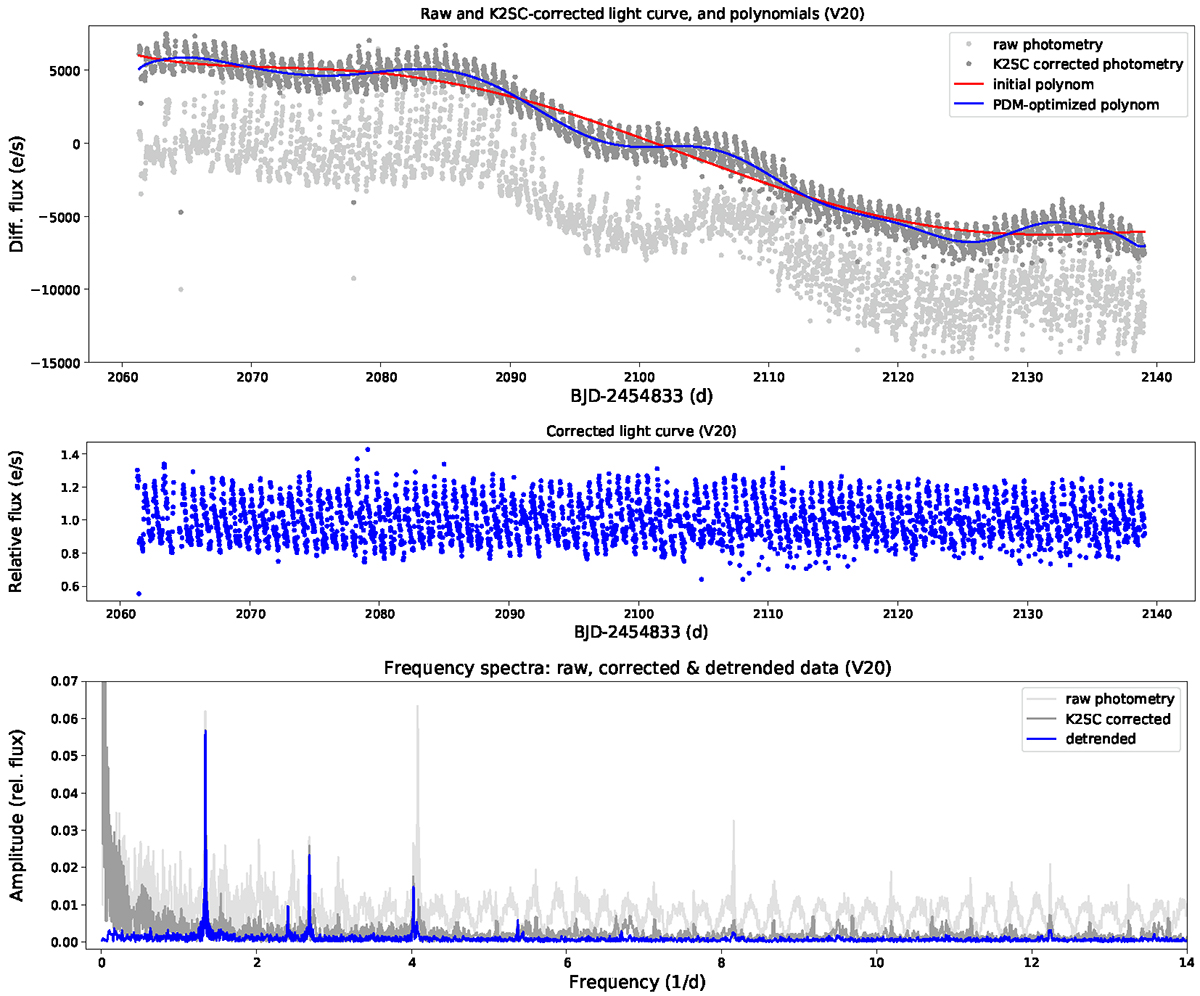
Download original image
Light curve correction steps demonstrated on RR Lyrae star V20, which is close to the core and hence strongly affected by systematics. Top: Raw differential-image photometry (light gray) and after we applied the K2SC method (dark gray). The red and blue lines are the initial 20th degree polynomial and the final, optimized with through PDM. Middle: Corrected and detrended light curve, in terms of the relative flux. Bottom: Frequency spectra of the light curves at each step.
Current usage metrics show cumulative count of Article Views (full-text article views including HTML views, PDF and ePub downloads, according to the available data) and Abstracts Views on Vision4Press platform.
Data correspond to usage on the plateform after 2015. The current usage metrics is available 48-96 hours after online publication and is updated daily on week days.
Initial download of the metrics may take a while.