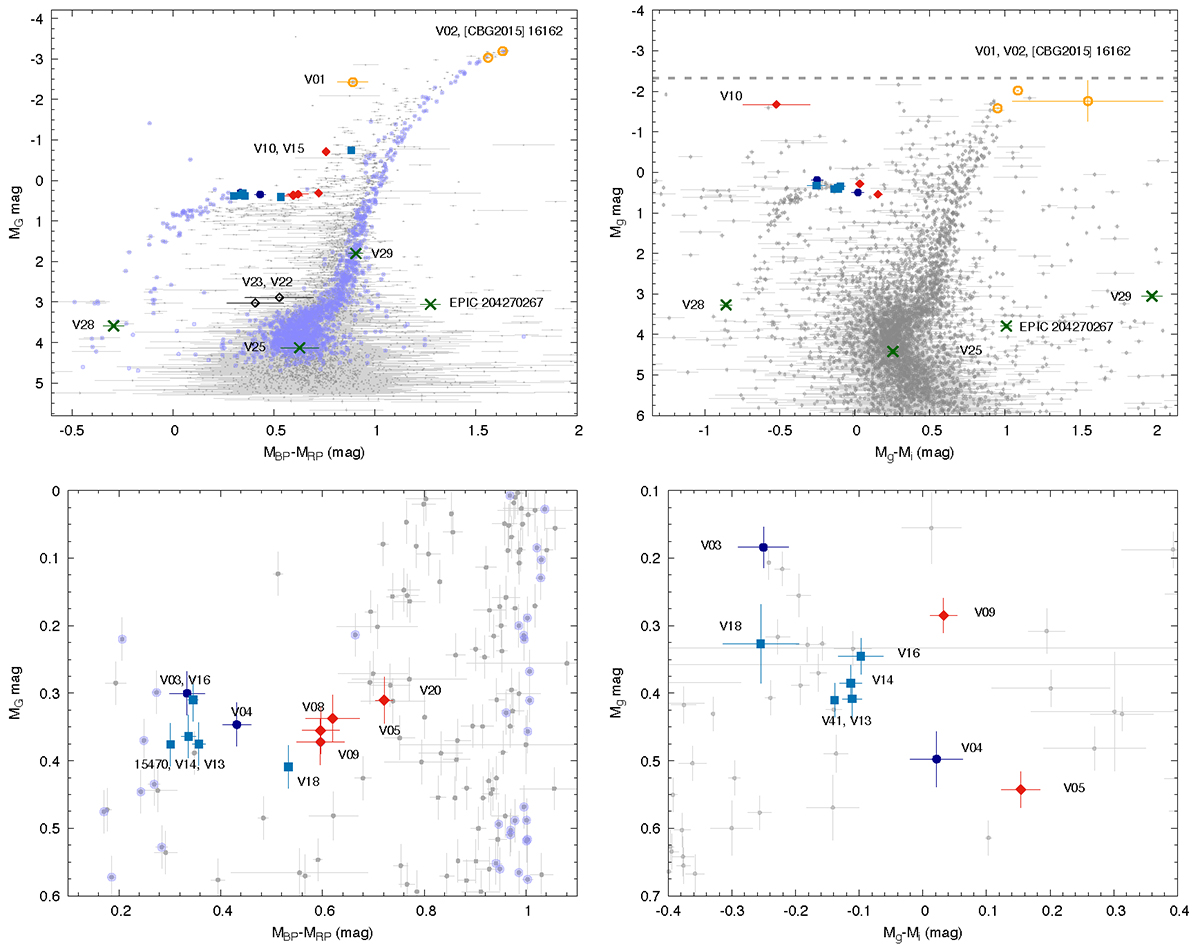
Fig. 17.
Download original image
Absolute color-magnitude diagrams. Left: diagrams based on Gaia EDR3. Gray points show all the stars in the K2 image mosaic. The cleaned CMD is shown with the blue points. Variables are indicated with larger symbols. Right: CMD based on the Pan-STARRS DR1 survey. The bottom plots show the areas around the RR Lyrae instability strip. Dark and light blue points are the regular and peculiar RRc stars, respectively; RRab stars are shown in red.
Current usage metrics show cumulative count of Article Views (full-text article views including HTML views, PDF and ePub downloads, according to the available data) and Abstracts Views on Vision4Press platform.
Data correspond to usage on the plateform after 2015. The current usage metrics is available 48-96 hours after online publication and is updated daily on week days.
Initial download of the metrics may take a while.