Fig. 7.
Download original image
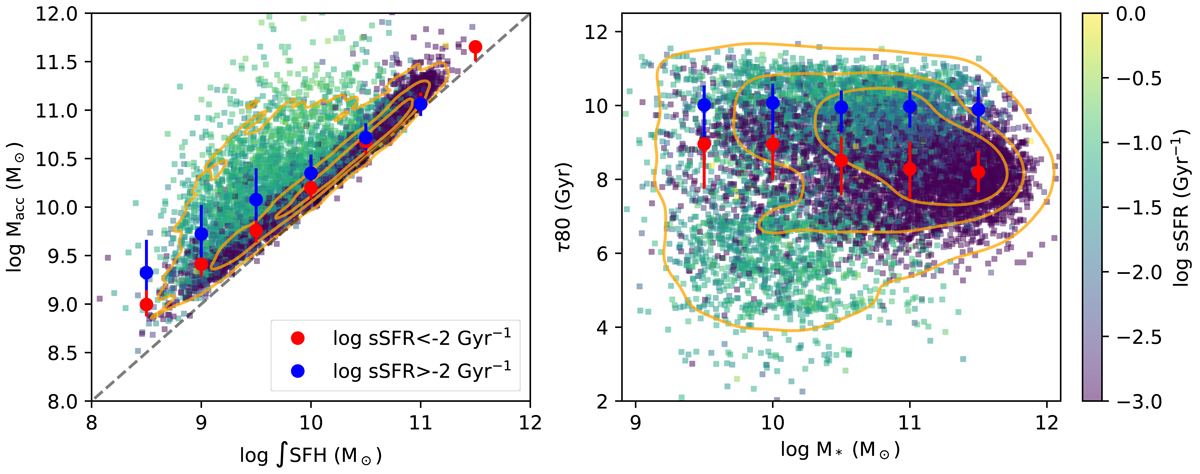
Results for the gas accretion histories obtained using the chemical and star formation history of each galaxy. In the left panel, we show the relation between the integrated SFHs and the accreted gas masses and in the right panel we show the relation between the current stellar masses and the 80s of the accretion histories. In both panels the color corresponds to the current sSFR values and the contours enclose 35%, 65% and 95% of the distribution. The thick points correspond to the median values within 0.5 dex wide mass bins separated into two sSFR ranges with the error bars marking the 25th and 75th percentiles. In the right panel, the logsSFR > −2 Gyr−1 averaged values do not include the cloud of points located below 8 Gyr in 80.
Current usage metrics show cumulative count of Article Views (full-text article views including HTML views, PDF and ePub downloads, according to the available data) and Abstracts Views on Vision4Press platform.
Data correspond to usage on the plateform after 2015. The current usage metrics is available 48-96 hours after online publication and is updated daily on week days.
Initial download of the metrics may take a while.