Fig. 2
Download original image
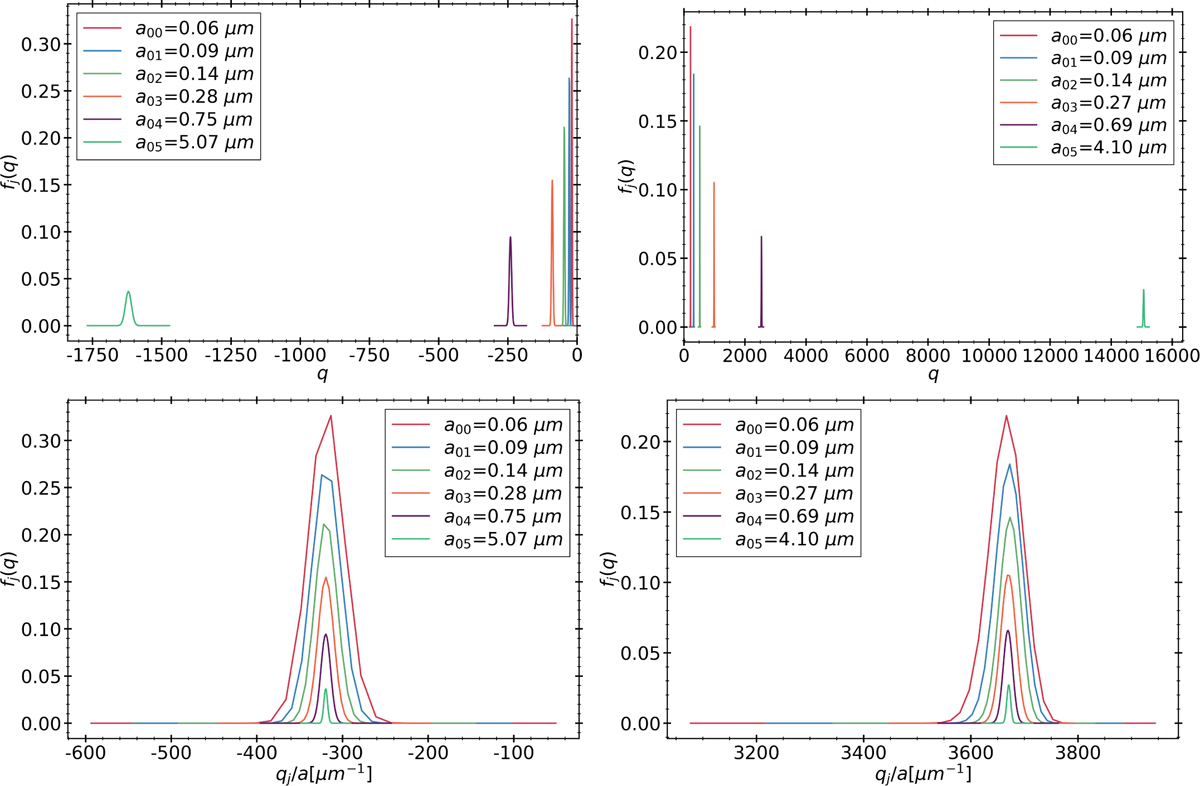
Overview of the charge distribution function fj(q). The two upper panels show the charge distribution function in relation to the charge held by each dust grain bin q. The lower panels also show the charge distribution function but in relation to total charge per dust grain bin size Q/a. The two left panels show the result at r = 0.1 au and in the midplane at z/r = 0 for each of the six different bins. The two right panels show the results also at r = 0.1 but higher up in the disk, at z/r = 0.3 Additionally, we show the size of each bin represented by a.
Current usage metrics show cumulative count of Article Views (full-text article views including HTML views, PDF and ePub downloads, according to the available data) and Abstracts Views on Vision4Press platform.
Data correspond to usage on the plateform after 2015. The current usage metrics is available 48-96 hours after online publication and is updated daily on week days.
Initial download of the metrics may take a while.