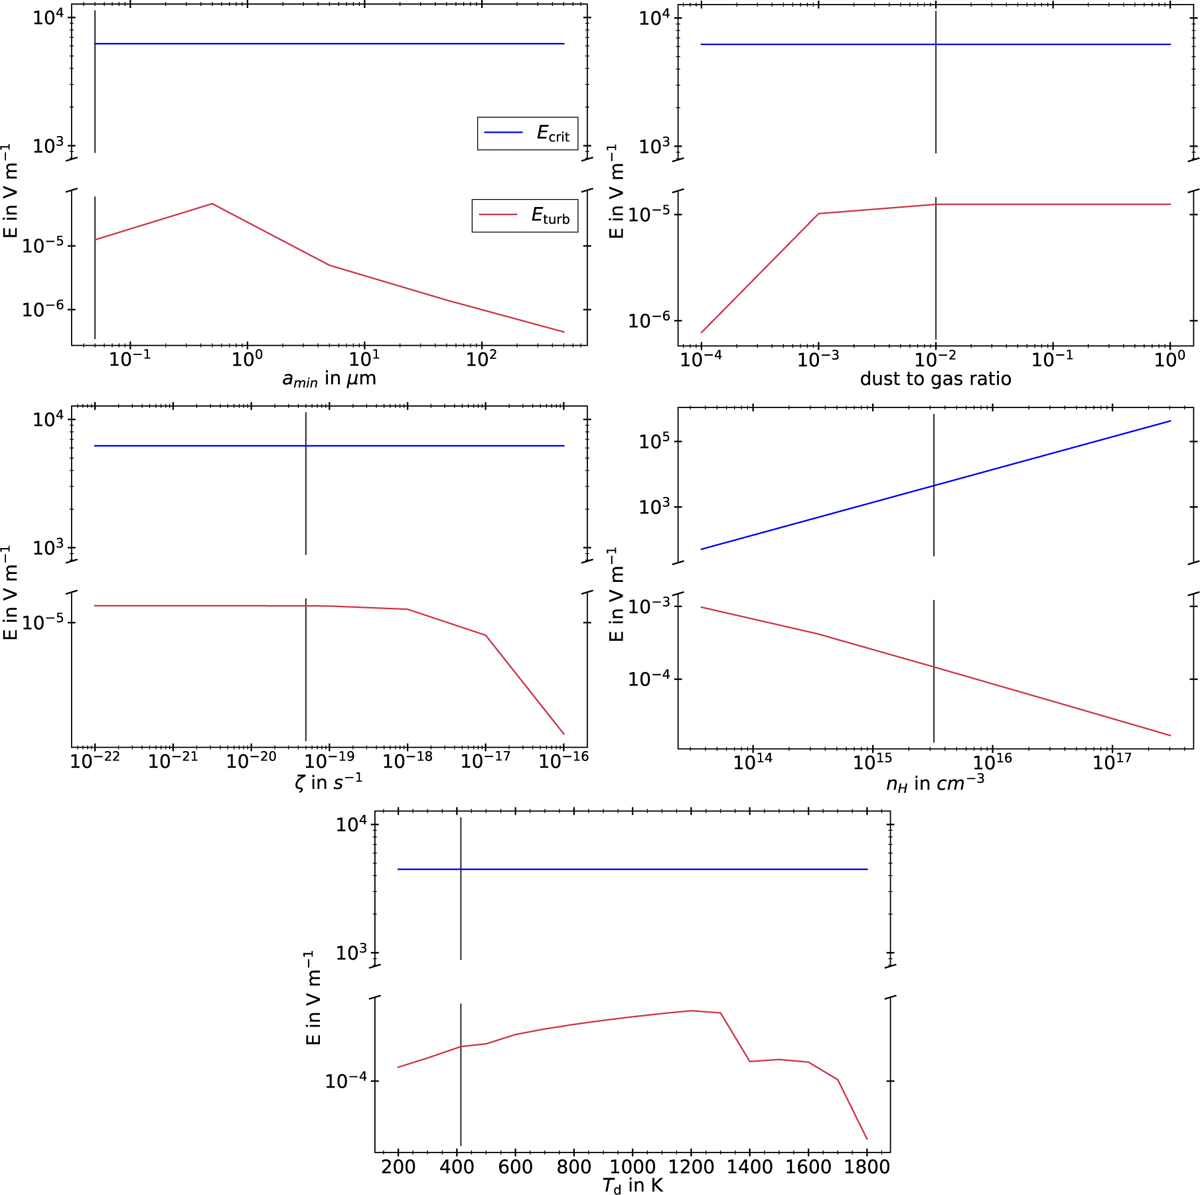
Fig. 15
Download original image
Electric fields resulting from turbulence induced eddies for the different parameter variations shown in Sect. 3.6. The red line represents said electric fields, and the blue line shows the critical electric field as from Eq. (75). The solid black lines again represent the conditions from our standard simulation. We note that for the sake of visibility, the y-axis is interrupted, as the differences between the critical fields and the turbulence induced fields are quite large.
Current usage metrics show cumulative count of Article Views (full-text article views including HTML views, PDF and ePub downloads, according to the available data) and Abstracts Views on Vision4Press platform.
Data correspond to usage on the plateform after 2015. The current usage metrics is available 48-96 hours after online publication and is updated daily on week days.
Initial download of the metrics may take a while.