Fig. 13
Download original image
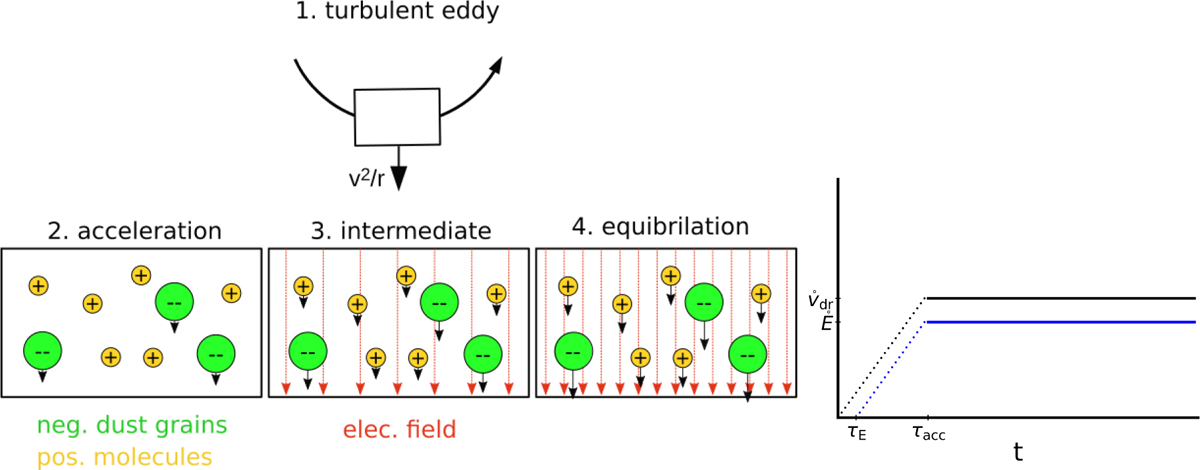
Sketch of our electrification model. The left-hand pictures show how the process evolves overtime for the related particles, and the right-hand side shows the time evolution of the drift velocity of the related particles and the electric fields. Left: Illustration of the different phases of our electrification model. Firstly, the centrifugal force in a turbulent eddy separates the charges until an electric field builds up, which causes the molecular cations to follow the negatively charged grains. Right: Example plot of the length of timescales for acceleration and equibrilation processes shown in the left illustration. The dotted line illustrates that either the dust grains have not reached the drift velocity (black) or that the electric field is not built up yet (blue). The units are arbitrary, as this plot was only made to make the model more understandable.
Current usage metrics show cumulative count of Article Views (full-text article views including HTML views, PDF and ePub downloads, according to the available data) and Abstracts Views on Vision4Press platform.
Data correspond to usage on the plateform after 2015. The current usage metrics is available 48-96 hours after online publication and is updated daily on week days.
Initial download of the metrics may take a while.