Fig. 12
Download original image
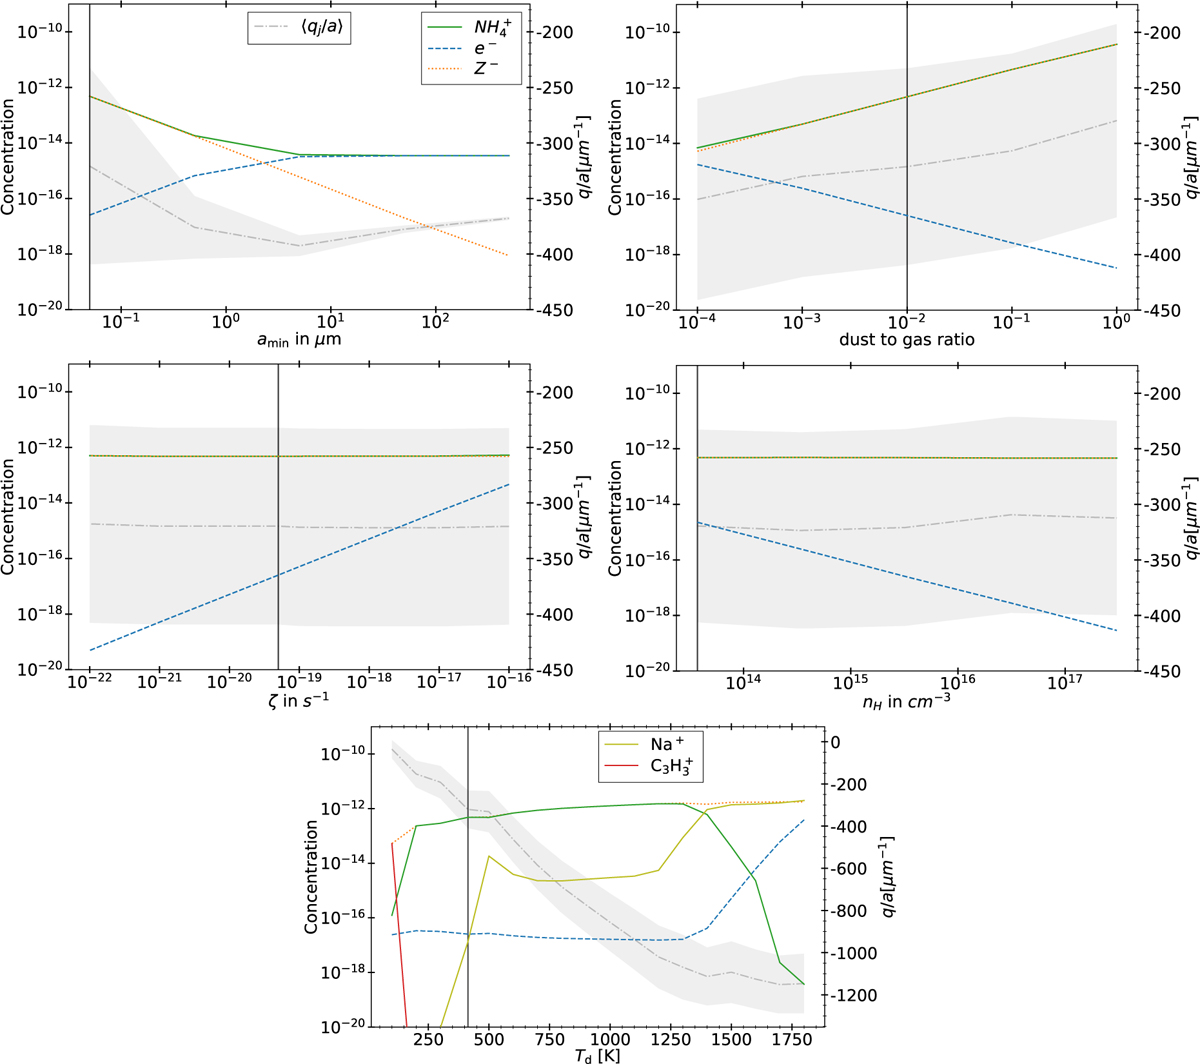
Results for the parameter analysis. For all panels, the solid green line represents the abundance of ![]() , the dotted orange line represents negatively charged dust grains abundance, and the dashed blue line represents the abundance of the electrons. In addition, the last plot shows the abundance of
, the dotted orange line represents negatively charged dust grains abundance, and the dashed blue line represents the abundance of the electrons. In addition, the last plot shows the abundance of ![]() in red and Na+ in yellow-green. All abundances are represented in units of hydrogen atom abundance, seen on the left Y-axis. The grey dash-dotted line represents the mean of the amount of charge a dust grain carries relative to its size in μm, qj/a. The shaded area around this line represents the average standard deviation of σj. In all plots, we also plotted a vertical black line that represents the conditions of the large simulation from which this set of simulations originates from. Upper-left panel: Results for the runs where we modify amin. Upper-right panel: Results where we modify the dust-to-gas ratio. Middle-left panel: Results where we modify the simulations with a constant cosmic ray ionization rate. Middle-right panel: Results where we modify the disk mass in order to increase the total gas density. Lower panel: Results where we modify the dust temperature.
in red and Na+ in yellow-green. All abundances are represented in units of hydrogen atom abundance, seen on the left Y-axis. The grey dash-dotted line represents the mean of the amount of charge a dust grain carries relative to its size in μm, qj/a. The shaded area around this line represents the average standard deviation of σj. In all plots, we also plotted a vertical black line that represents the conditions of the large simulation from which this set of simulations originates from. Upper-left panel: Results for the runs where we modify amin. Upper-right panel: Results where we modify the dust-to-gas ratio. Middle-left panel: Results where we modify the simulations with a constant cosmic ray ionization rate. Middle-right panel: Results where we modify the disk mass in order to increase the total gas density. Lower panel: Results where we modify the dust temperature.
Current usage metrics show cumulative count of Article Views (full-text article views including HTML views, PDF and ePub downloads, according to the available data) and Abstracts Views on Vision4Press platform.
Data correspond to usage on the plateform after 2015. The current usage metrics is available 48-96 hours after online publication and is updated daily on week days.
Initial download of the metrics may take a while.