Fig. 8.
Download original image
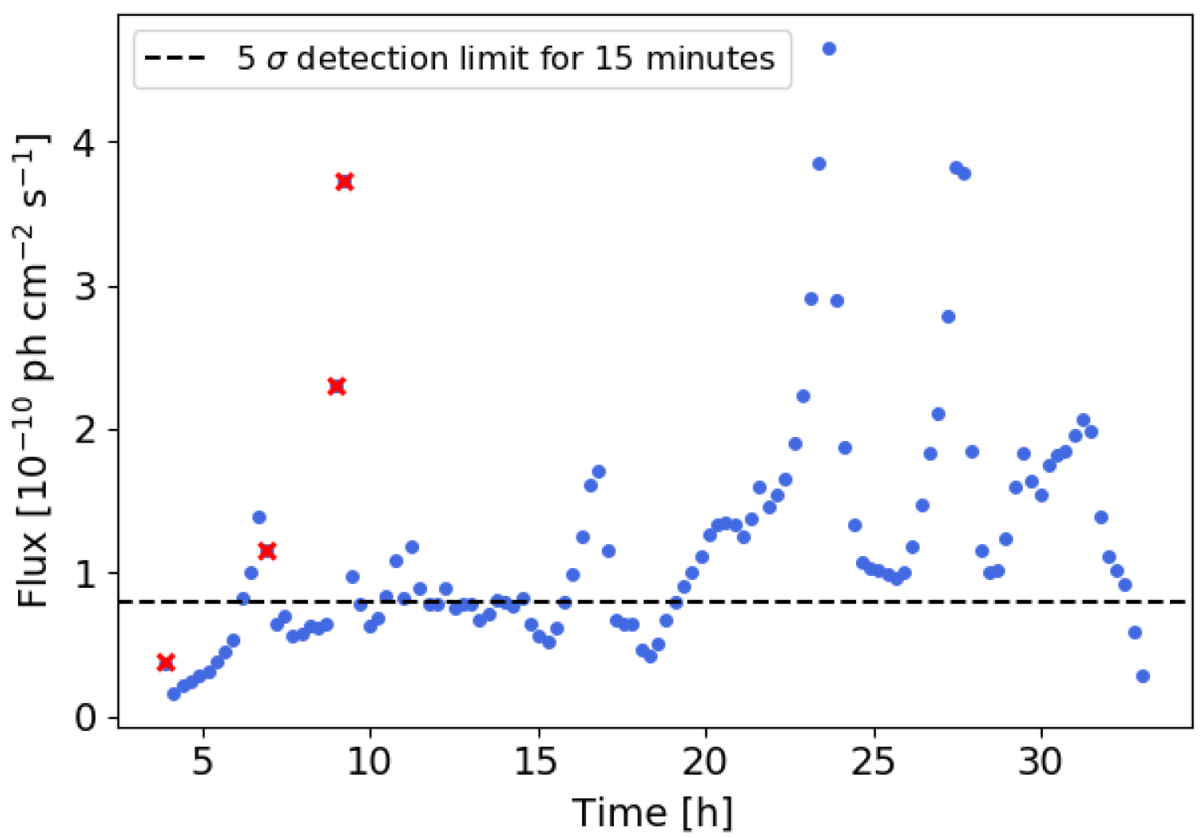
Example of a binned simulated light curve where the data points with fast variability are flagged (red crosses). The black dashed line shows the 5σ detection limit for the given energy range with 15-min integration time for detecting such variability with the current generation IACTs. Data points below the limit are neglected.
Current usage metrics show cumulative count of Article Views (full-text article views including HTML views, PDF and ePub downloads, according to the available data) and Abstracts Views on Vision4Press platform.
Data correspond to usage on the plateform after 2015. The current usage metrics is available 48-96 hours after online publication and is updated daily on week days.
Initial download of the metrics may take a while.