Fig. 17.
Download original image
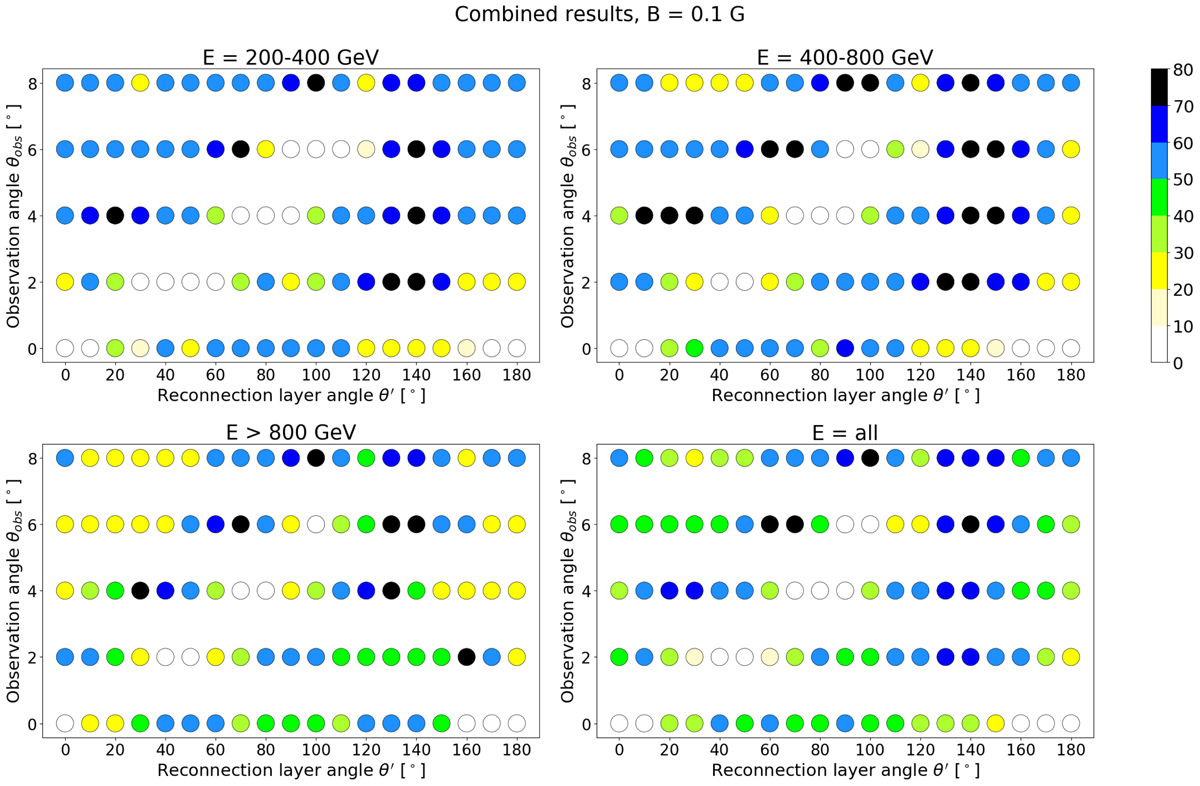
Combined test results for the simulations with B = 0.1 G for the three energy bands and also the results of all bands together (lower right panel). The individual test results shown in Figs. 16, B.1, and B.2 are combined first separately for each respective energy band. Each test has an equal contribution weight to the combined result, i.e. a 100% match in an individual test means a 25% match in the combined test of an individual energy band and an ∼8.3% match when combining all bands. The gold sample is defined as those simulations that exceed the 70% match threshold in the combination plot of all energy bands.
Current usage metrics show cumulative count of Article Views (full-text article views including HTML views, PDF and ePub downloads, according to the available data) and Abstracts Views on Vision4Press platform.
Data correspond to usage on the plateform after 2015. The current usage metrics is available 48-96 hours after online publication and is updated daily on week days.
Initial download of the metrics may take a while.