Fig. 13.
Download original image
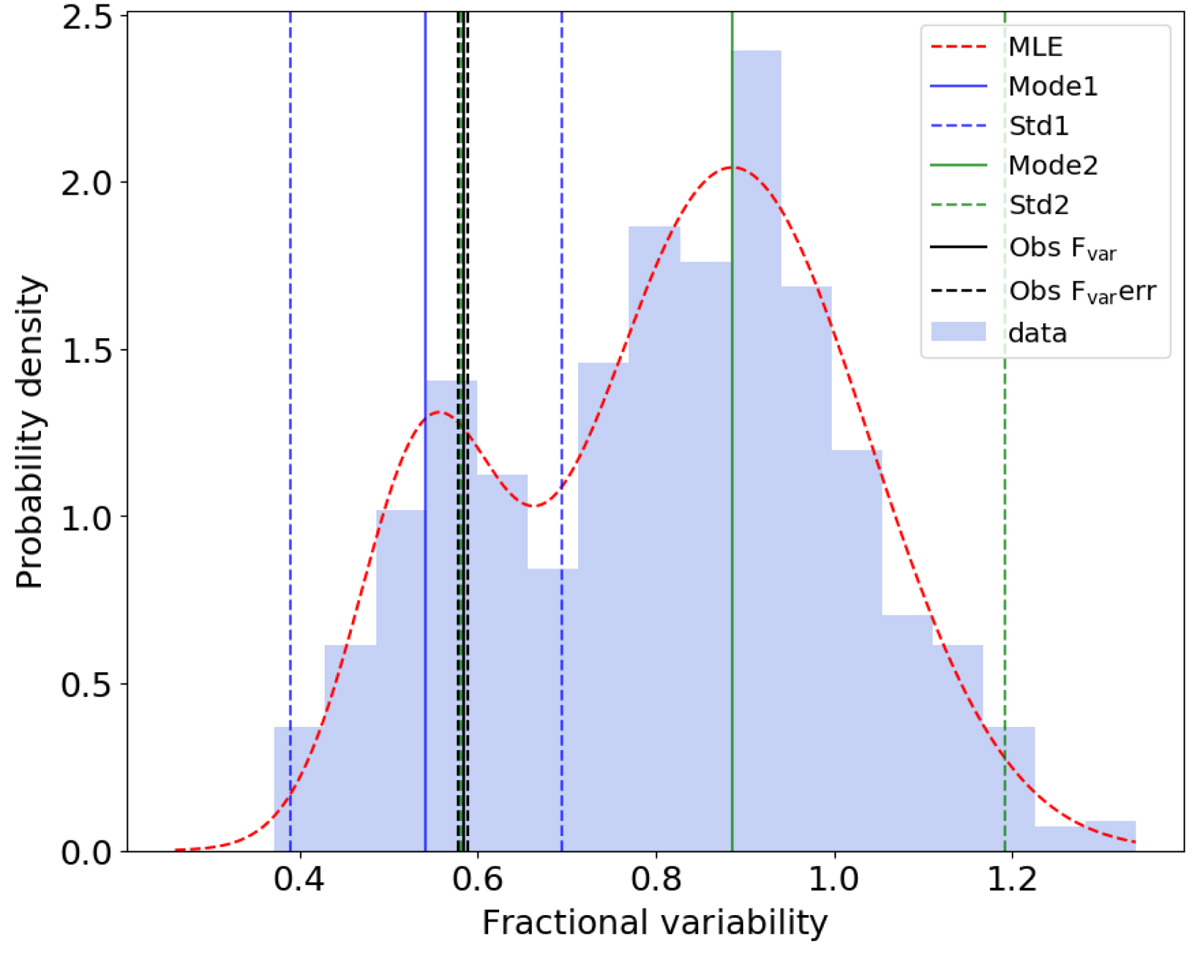
Example plot of the fractional variability comparison where the histogram shows the distribution of the fractional variability factors from all the samples of one simulation. In this case, we fitted the distribution with two Gaussian shapes, and the red dashed line shows the sum of this fit. The black line shows the observed value (errors with black dashed lines) in comparison with the distribution modes and their 2σ limits (black and green lines, 2σ limits with dashed lines).
Current usage metrics show cumulative count of Article Views (full-text article views including HTML views, PDF and ePub downloads, according to the available data) and Abstracts Views on Vision4Press platform.
Data correspond to usage on the plateform after 2015. The current usage metrics is available 48-96 hours after online publication and is updated daily on week days.
Initial download of the metrics may take a while.