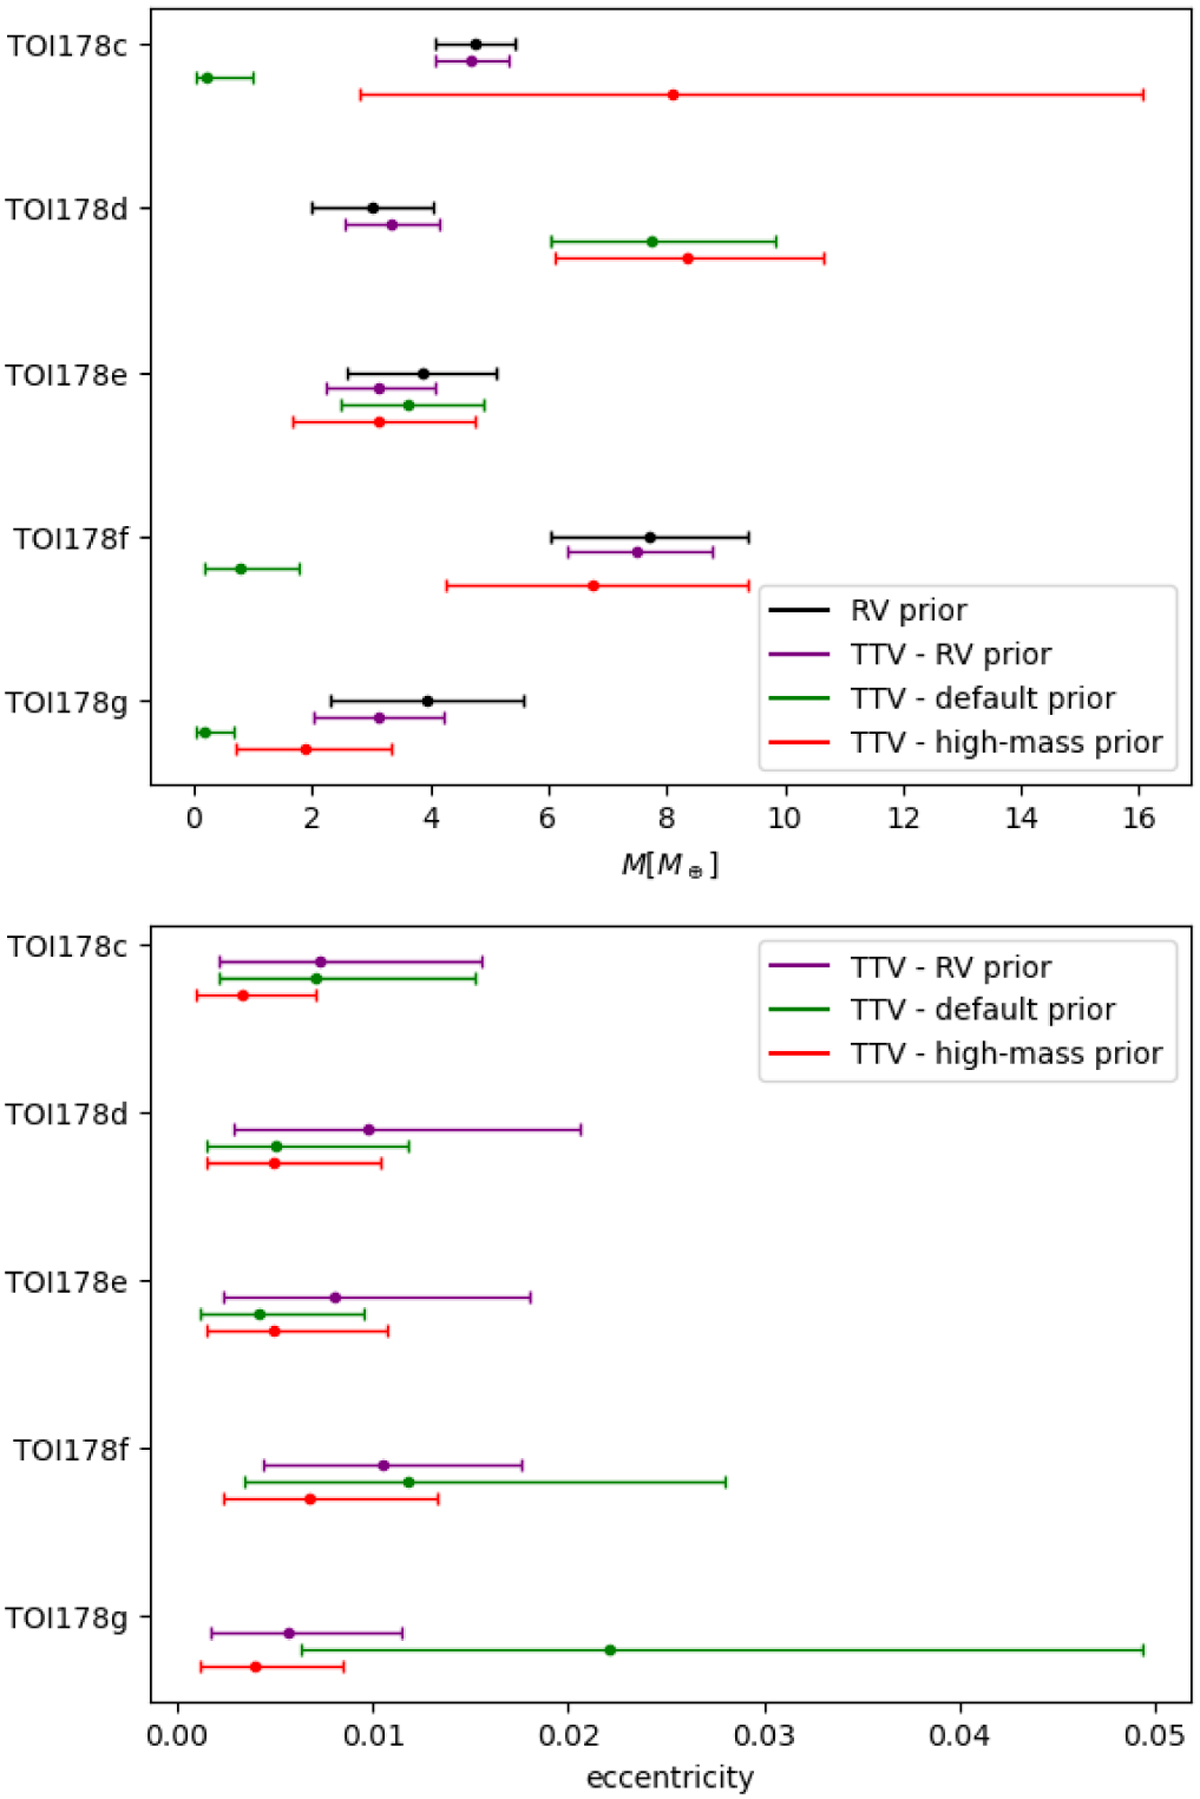
Fig. 4

Download original image
Mass (upper panel) and eccentricity (lower panel) posteriors derived from our dynamical analysis of the TTVs. The corresponding values are given in Table D.1. In the upper panel, the RV prior based on the RV measurements presented in L21 is shown in black, with 1σ error bars. The coloured error bars show the median and .16–.84 quantiles confidence level of the mass posteriors obtained from our TTV fit using three different sets of priors.
Current usage metrics show cumulative count of Article Views (full-text article views including HTML views, PDF and ePub downloads, according to the available data) and Abstracts Views on Vision4Press platform.
Data correspond to usage on the plateform after 2015. The current usage metrics is available 48-96 hours after online publication and is updated daily on week days.
Initial download of the metrics may take a while.


