Fig. 3.
Download original image
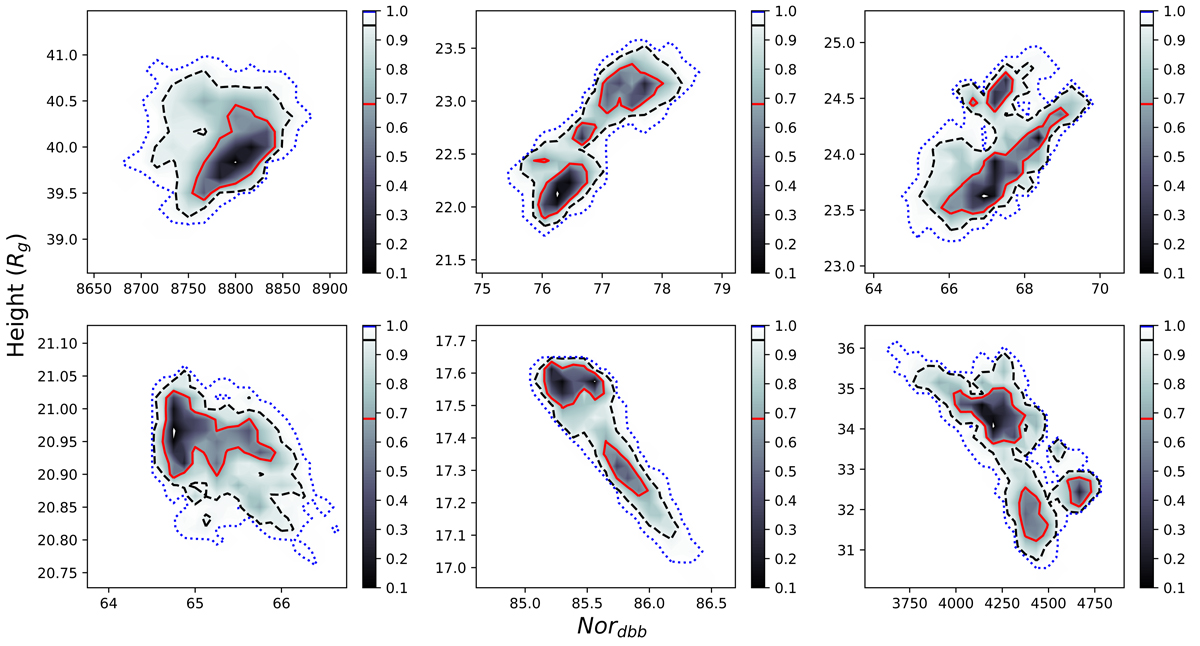
Normalization of DISKBB component vs. height of the corona calculated from MCMC techniques for the six observations of 4U 1636–53. The Goodman-Weare algorithm was used with eight walkers and a total length of 10 000 steady-state samples for the simulation of each observation, with the initial 2000 chains removed to avoid an unstable state. For clarity, the 68%, 95%, and 99.7% confidence levels are indicated as the red solid line, black dashed line, and blue dotted line, respectively.
Current usage metrics show cumulative count of Article Views (full-text article views including HTML views, PDF and ePub downloads, according to the available data) and Abstracts Views on Vision4Press platform.
Data correspond to usage on the plateform after 2015. The current usage metrics is available 48-96 hours after online publication and is updated daily on week days.
Initial download of the metrics may take a while.