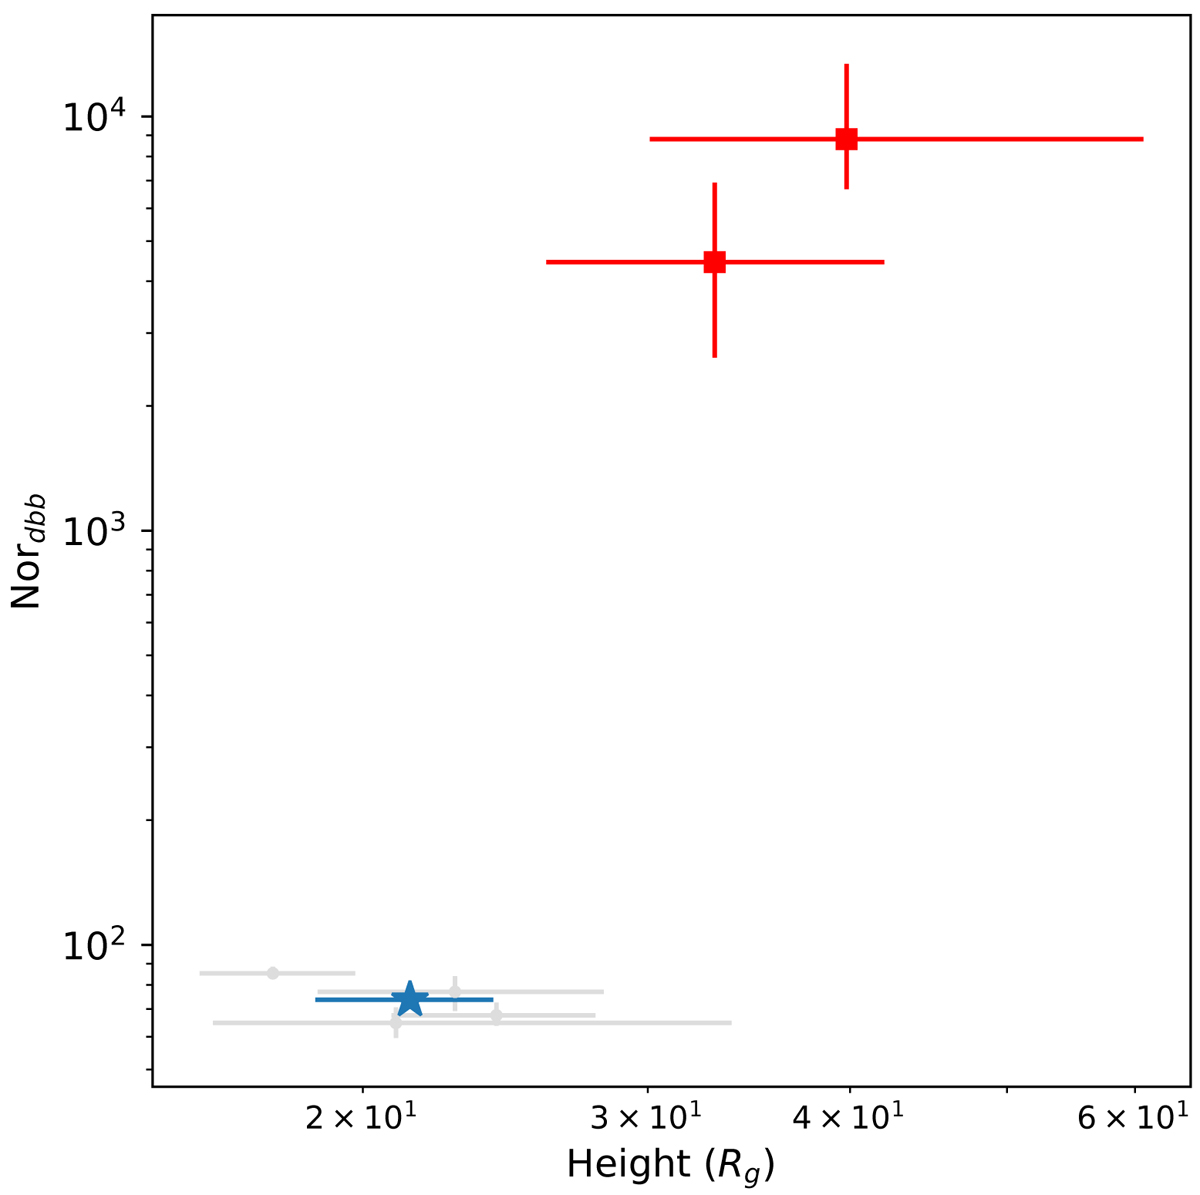
Fig. 2.
Download original image
Normalization of DISKBB component vs. height of the corona for the observations of 4U 1636–53 in this work. Here are shown 1σ error bars, and the hard observations (X1 and X6) and soft observations (X2−X5) are indicated with red squares and gray circles, respectively. The average of the soft observations is shown as a blue star for clarity.
Current usage metrics show cumulative count of Article Views (full-text article views including HTML views, PDF and ePub downloads, according to the available data) and Abstracts Views on Vision4Press platform.
Data correspond to usage on the plateform after 2015. The current usage metrics is available 48-96 hours after online publication and is updated daily on week days.
Initial download of the metrics may take a while.