Open Access
Fig. 1.
Download original image
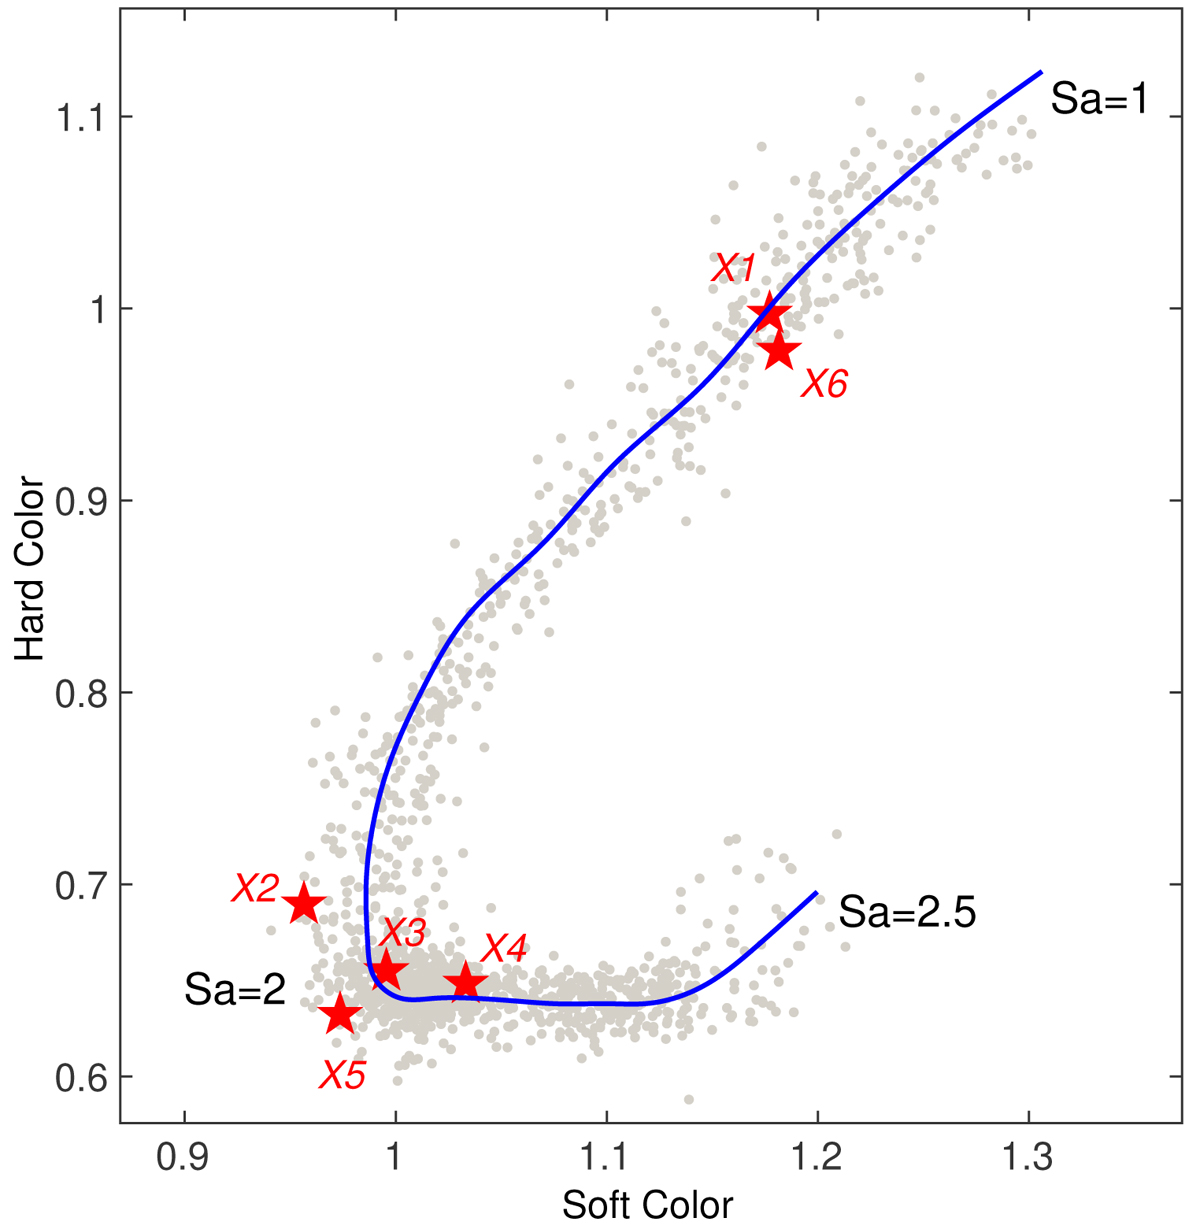
Color-color diagram of 4U 1636–53. Each gray point represents a single RXTE observation. The red stars indicate the six observations in this work. The position of the source in the diagram is parameterized by the length of the blue solid curve Sa.
Current usage metrics show cumulative count of Article Views (full-text article views including HTML views, PDF and ePub downloads, according to the available data) and Abstracts Views on Vision4Press platform.
Data correspond to usage on the plateform after 2015. The current usage metrics is available 48-96 hours after online publication and is updated daily on week days.
Initial download of the metrics may take a while.