Fig. 7
Download original image
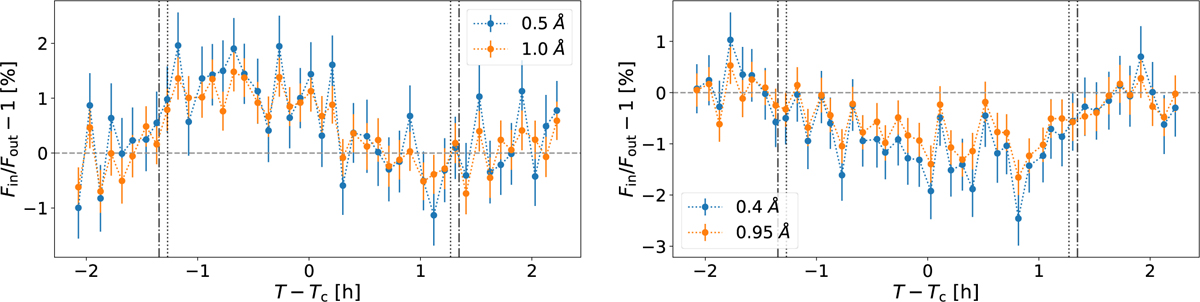
Transit light curves of Hα (left) and He I triplet (right). The He I light curve has been constructed integrating the counts of the residual map in the planet rest frame around λ0 using σ (blue) and FWHM (orange) wavelength band passes from Table D.1. For the Hα light curve, we considered two generic band passes. The vertical lines represent the different contacts during the transit. Note the different y-axis scales between plots.
Current usage metrics show cumulative count of Article Views (full-text article views including HTML views, PDF and ePub downloads, according to the available data) and Abstracts Views on Vision4Press platform.
Data correspond to usage on the plateform after 2015. The current usage metrics is available 48-96 hours after online publication and is updated daily on week days.
Initial download of the metrics may take a while.