Open Access
Fig. D.2
Download original image
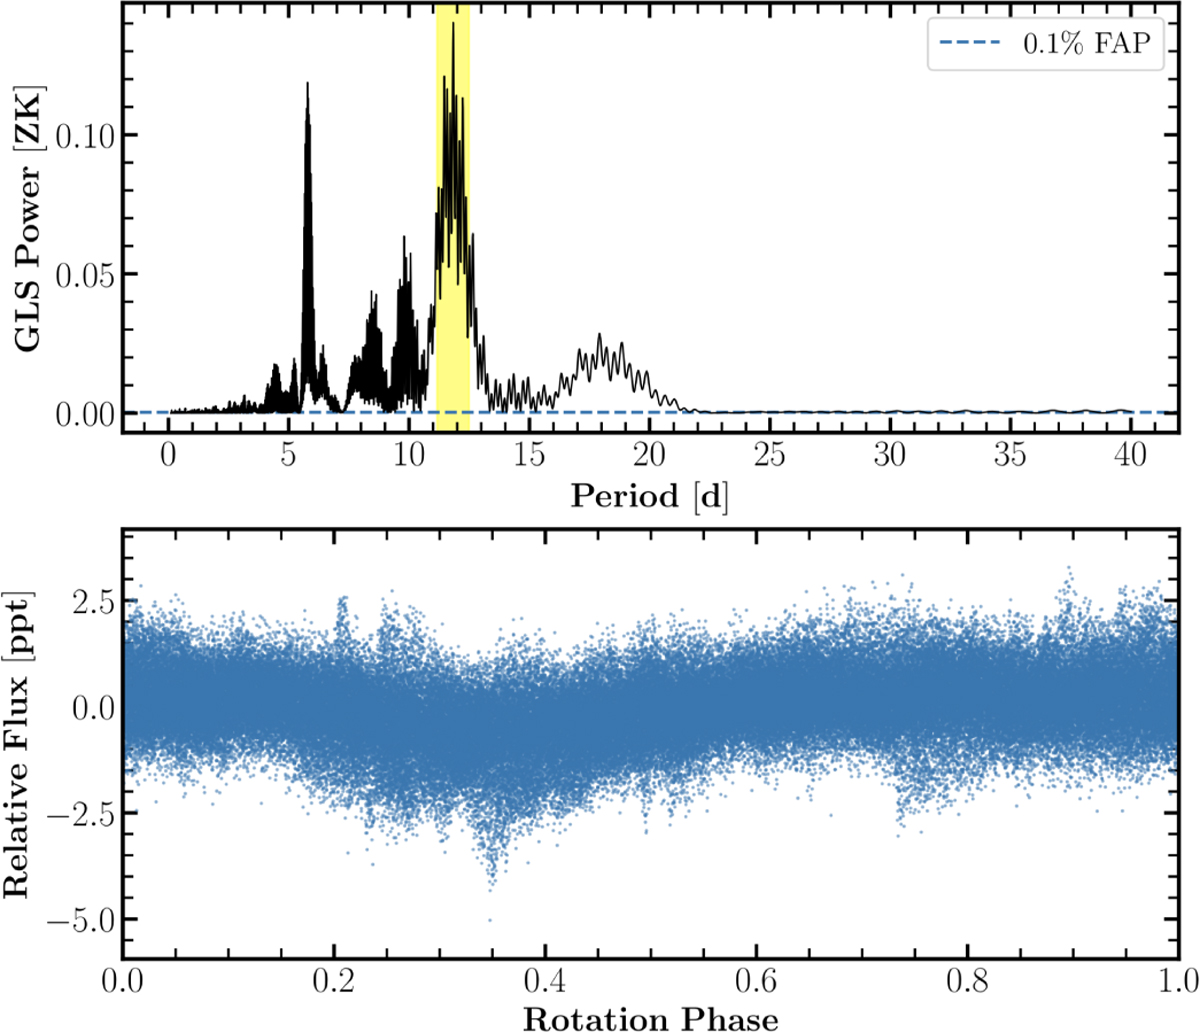
GLS periodogram of the TESS photometry that includes the combination of all sectors (top panel). The yellow vertical band shows the maximum peak found, whose period we associate with the rotation period of the star. Phase-folded plot for the period of 11.8 days (bottom panel).
Current usage metrics show cumulative count of Article Views (full-text article views including HTML views, PDF and ePub downloads, according to the available data) and Abstracts Views on Vision4Press platform.
Data correspond to usage on the plateform after 2015. The current usage metrics is available 48-96 hours after online publication and is updated daily on week days.
Initial download of the metrics may take a while.