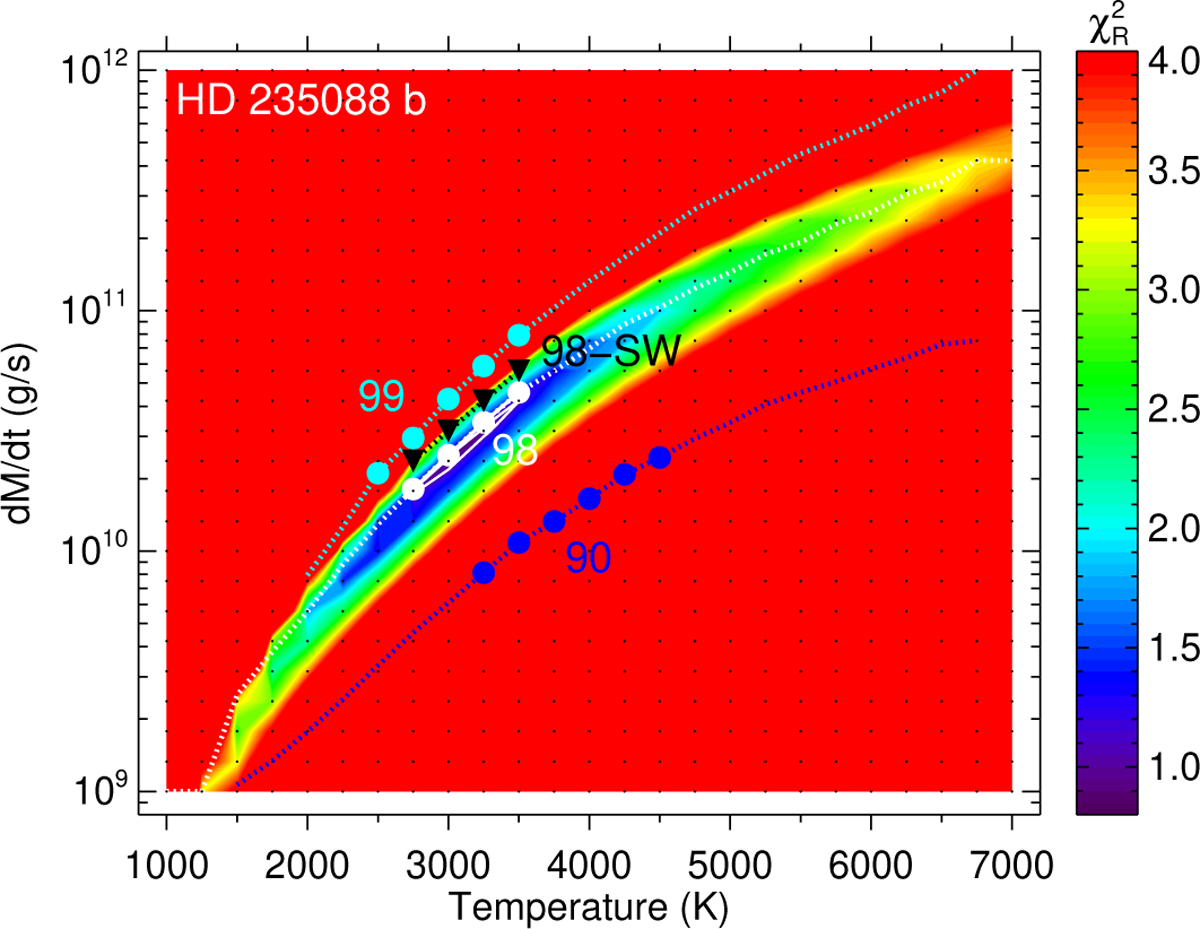
Fig. 10
Download original image
Contour maps of the reduced χ2 of the He(23S) absorption obtained in the modeling for an H/He of 98/2. Dotted curves represent the best fits, with filled symbols denoting the constrained ranges for Ṁ and temperature for a confidence level of 95%. We over-plotted the curves and symbols when including the estimated effects of the stellar winds (H/He = 98/2, downward triangles) and for H/He ratios of 99/1 and 90/10. The labels correspond to the hydrogen percentage, e.g. ‘98’ for an H/He of 98/2. The small black dots represent the T-Ṁ grid of the simulations.
Current usage metrics show cumulative count of Article Views (full-text article views including HTML views, PDF and ePub downloads, according to the available data) and Abstracts Views on Vision4Press platform.
Data correspond to usage on the plateform after 2015. The current usage metrics is available 48-96 hours after online publication and is updated daily on week days.
Initial download of the metrics may take a while.