Open Access
Fig. 4.
Download original image
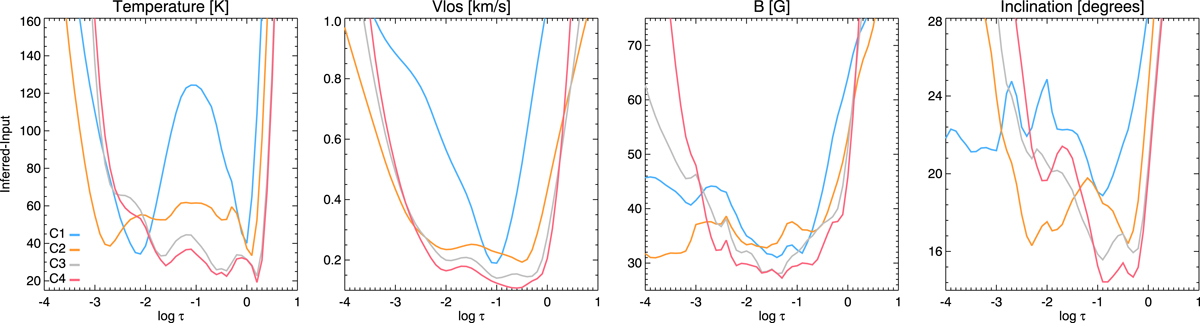
Average differences between the input and the inferred atmosphere at different optical depths. From left to right, we show the differences in temperature, LOS velocity, magnetic field strength, and inclination, respectively. Colours correspond to the various inversion configurations indicated in Table 1.
Current usage metrics show cumulative count of Article Views (full-text article views including HTML views, PDF and ePub downloads, according to the available data) and Abstracts Views on Vision4Press platform.
Data correspond to usage on the plateform after 2015. The current usage metrics is available 48-96 hours after online publication and is updated daily on week days.
Initial download of the metrics may take a while.