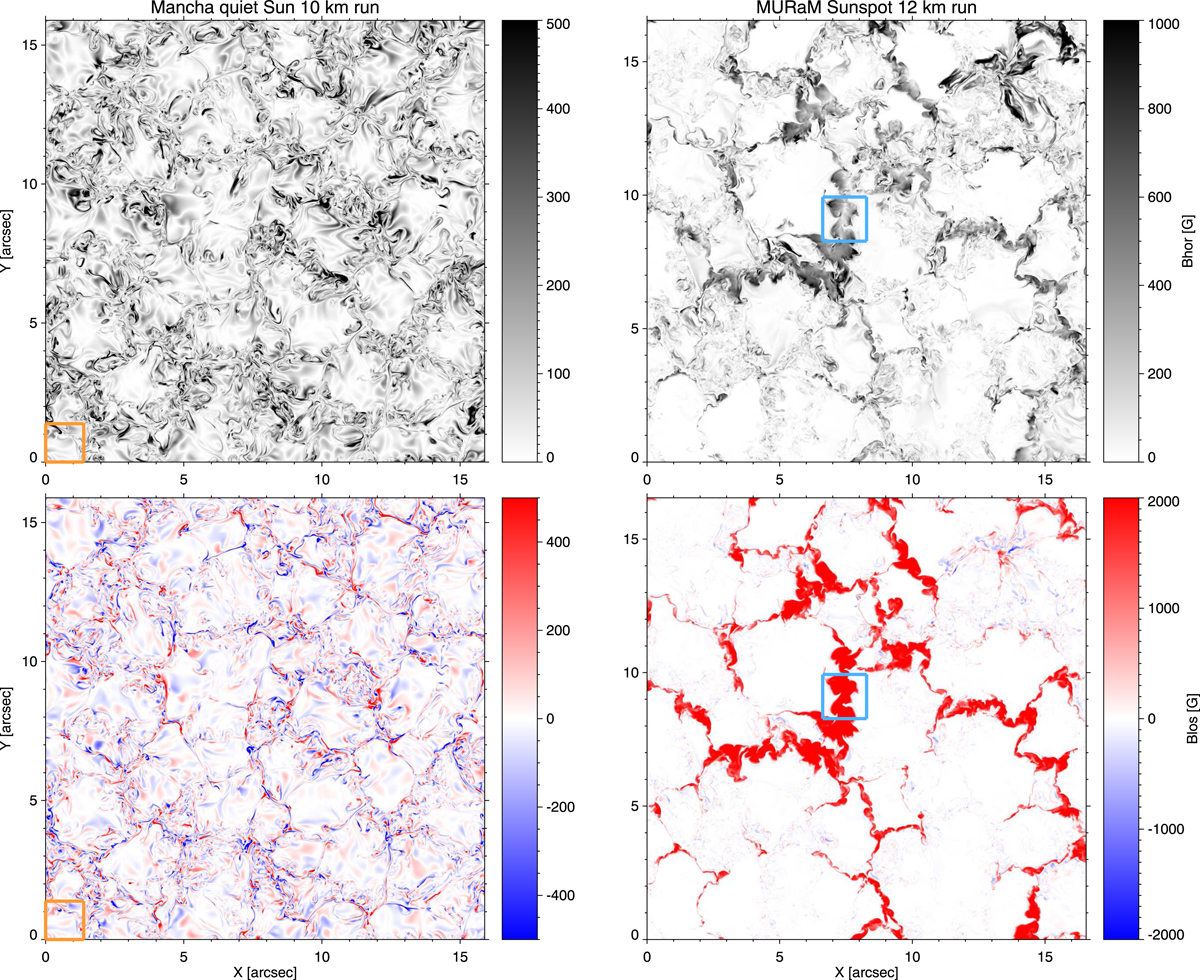
Fig. 2.
Download original image
Spatial distribution of the horizontal (top) and longitudinal (bottom) component of the magnetic field where log τ = 0. The left panel corresponds to a quiet Sun run with 10 km spatial resolution generated with the MANCHA code, while the right panel shows a cut of the original Sunspot run with 12 km spatial resolution computed with the MURaM code.
Current usage metrics show cumulative count of Article Views (full-text article views including HTML views, PDF and ePub downloads, according to the available data) and Abstracts Views on Vision4Press platform.
Data correspond to usage on the plateform after 2015. The current usage metrics is available 48-96 hours after online publication and is updated daily on week days.
Initial download of the metrics may take a while.