Fig. 11.
Download original image
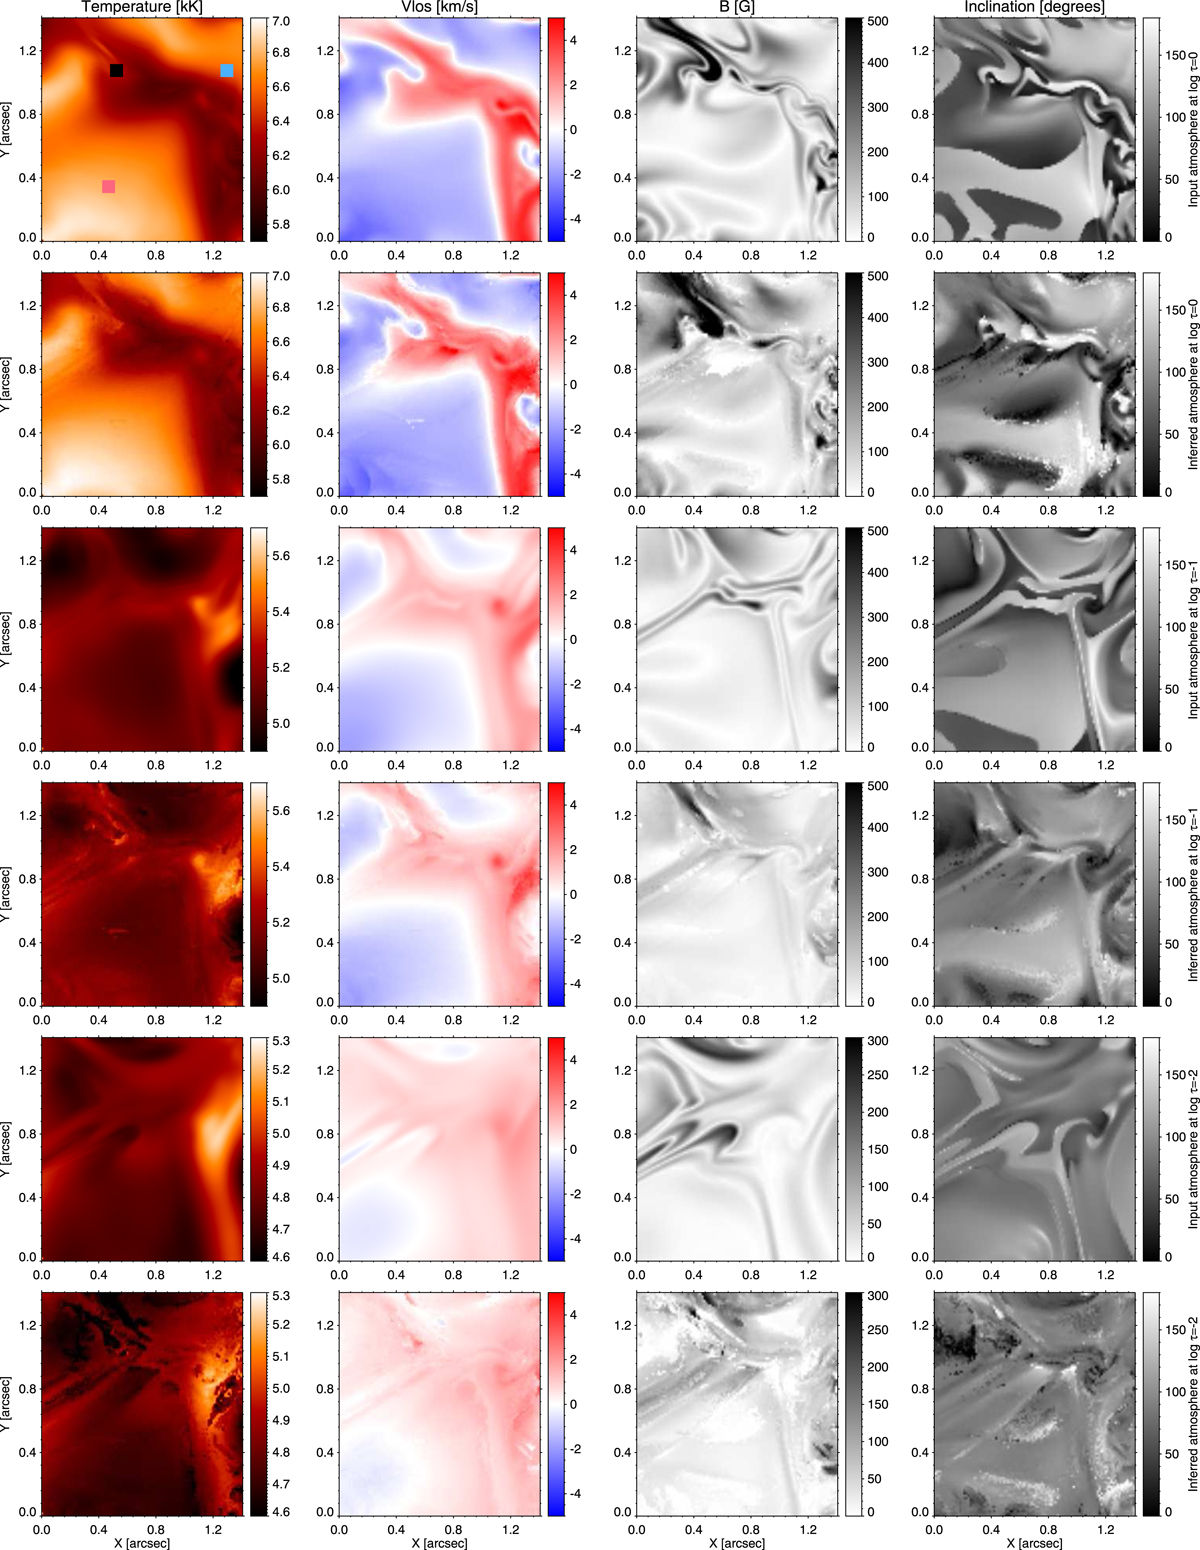
Comparison between the input atmosphere (odd rows) and the one inferred with SIR using configuration C4 and the weights W2 (even rows). From left to right, we show the temperature, LOS velocity, magnetic field strength, and inclination. From top to bottom, we display the spatial distribution of the atmospheric parameters at three reference layers at log τ500 = [0, −1, −2]. The FOV corresponds to the spatial domain within the square region (orange) in the top panel of Fig. 1. Coloured squares in the top leftmost panel designate the locations of the pixels studied in Figs. 5 and 6. Black, blue, and red correspond to the top, middle, and bottom rows in the cited figures, respectively.
Current usage metrics show cumulative count of Article Views (full-text article views including HTML views, PDF and ePub downloads, according to the available data) and Abstracts Views on Vision4Press platform.
Data correspond to usage on the plateform after 2015. The current usage metrics is available 48-96 hours after online publication and is updated daily on week days.
Initial download of the metrics may take a while.