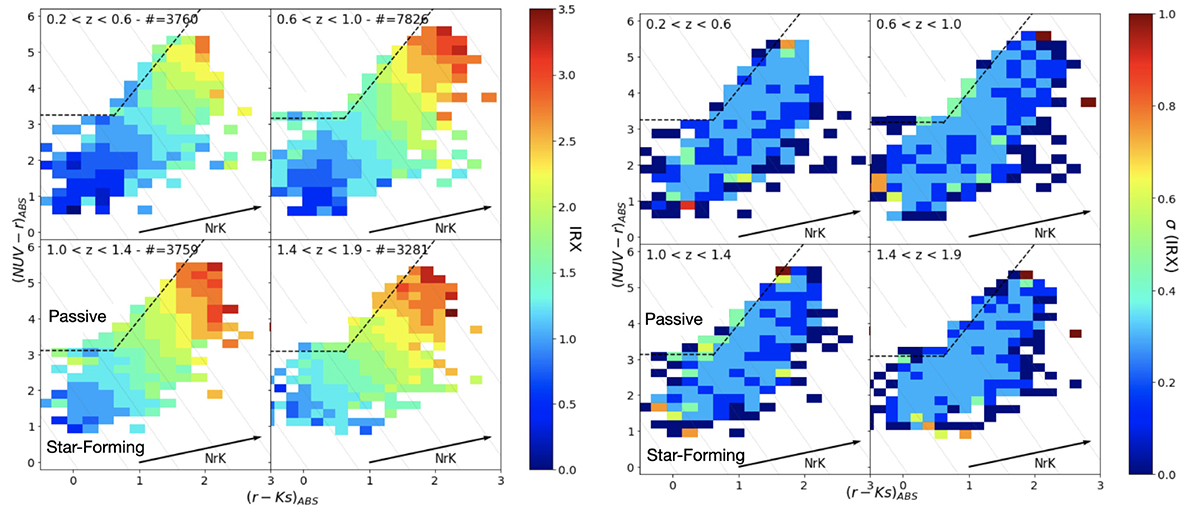
Fig. 3.
Download original image
Behavior of the IRX in the NUVrK color-color diagram. Left: Mean IRX (⟨IRX⟩ color-coded in logarithmic scale) in four redshift bins. The thin parallel lines show the modeled evolution of the ⟨IRX⟩ stripes with the norm of the NrK vector perpendicular to them. In each panel, the dotted line indicates the region of passive galaxies (Moutard et al. 2016a) that are not included in this analysis. Right: Same as the left panel but for the dispersion around the mean (σ(IRX)), color-coded in a logarithmic scale.
Current usage metrics show cumulative count of Article Views (full-text article views including HTML views, PDF and ePub downloads, according to the available data) and Abstracts Views on Vision4Press platform.
Data correspond to usage on the plateform after 2015. The current usage metrics is available 48-96 hours after online publication and is updated daily on week days.
Initial download of the metrics may take a while.