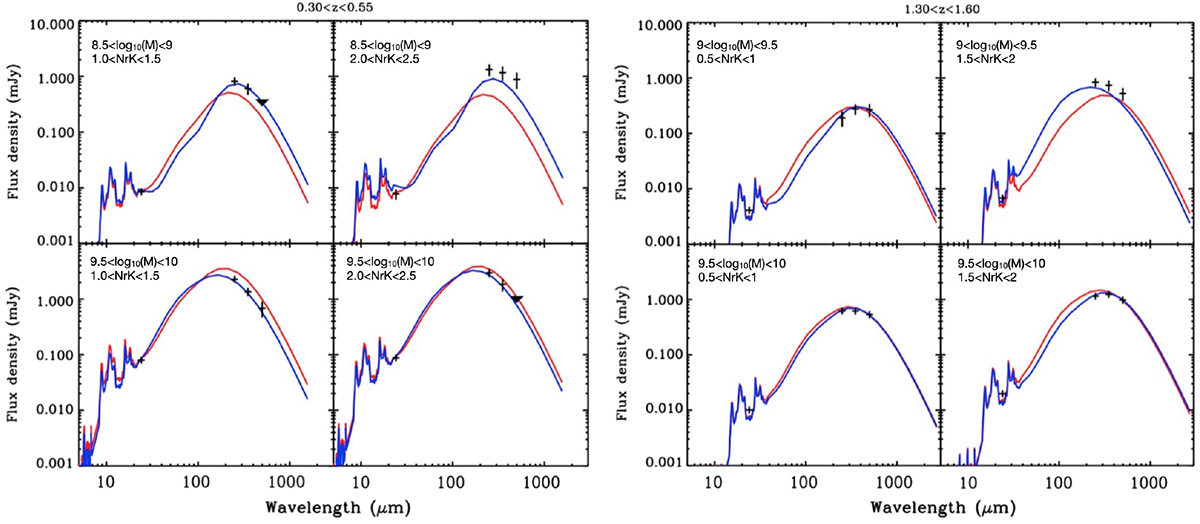
Fig. A.2.
Download original image
Averaged MIR and FIR SED fitting of galaxy subsamples at 0.3 < z < 0.55 (left panel) and 1.3 < z < 1.6 (right panel), based on fluxes derived from the mean stacking technique described in Appendix A. For each redshift range, SED fits are illustrated for two different bins of stellar mass and two bins of NRK color. The best SED fits are shown with the solid blue curves, while the red curves represent SEDs extrapolated from the 24 μm flux. Downward filled triangles depict upper limits for the stacked fluxes at 500 μm.
Current usage metrics show cumulative count of Article Views (full-text article views including HTML views, PDF and ePub downloads, according to the available data) and Abstracts Views on Vision4Press platform.
Data correspond to usage on the plateform after 2015. The current usage metrics is available 48-96 hours after online publication and is updated daily on week days.
Initial download of the metrics may take a while.