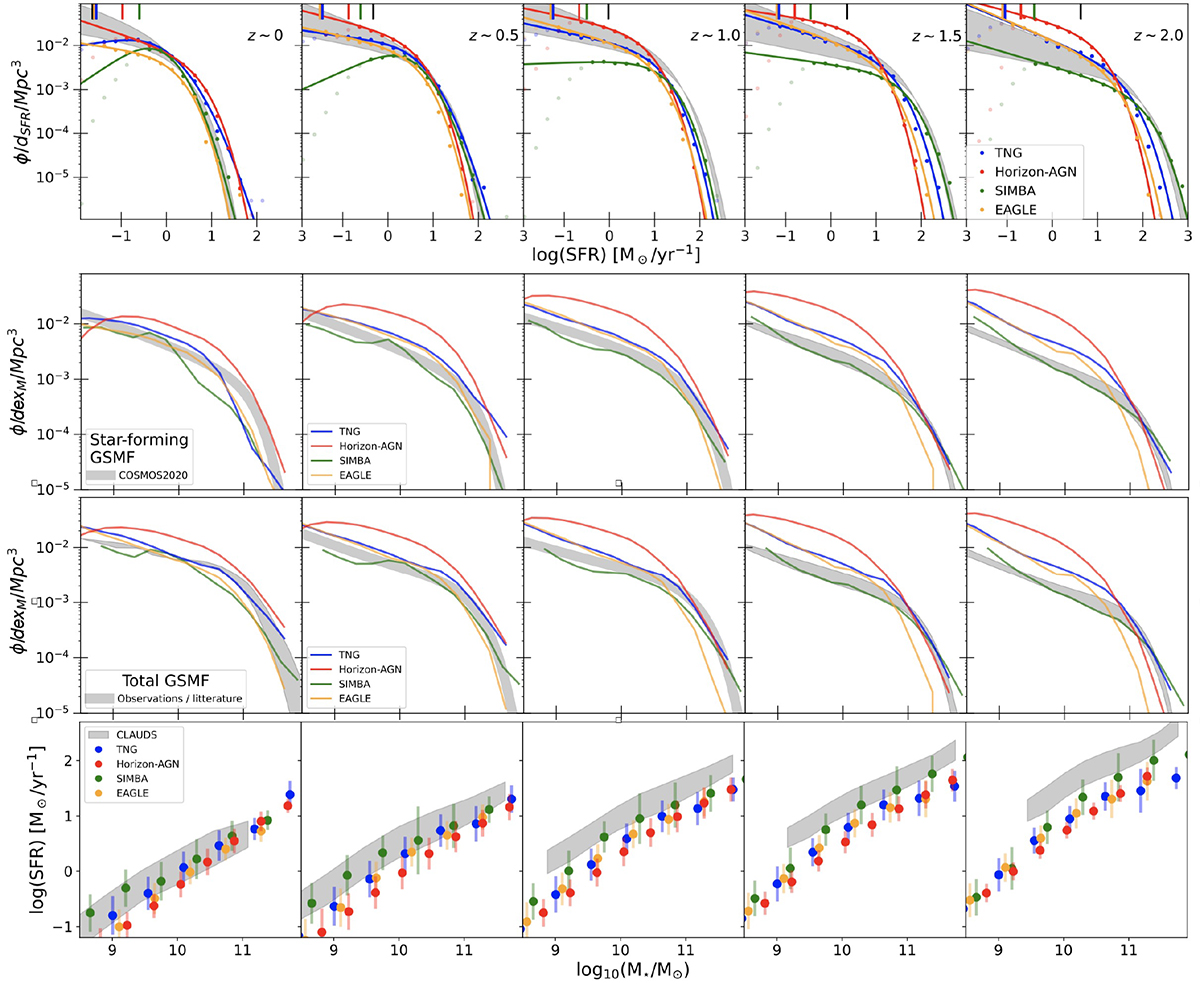
Fig. 15.
Download original image
SFR functions, stellar mass functions, and MS predicted by simulations: Top row: Comparison of the SFR functions for the SFGs (gray-shaded area based on the faint end slope uncertainty) with those from the four simulations in five redshift bins: TNG100 (blue), HORIZON-AGN (red), SIMBA (green), and EAGLE (orange). On the top axis, the vertical marks correspond to the SFR limits used to fit the observations (black) and the simulations (colored marks) as described in Sects. 5.3 and 5.5. The data points from the simulations are fitted by a Schechter or double-power-law function (thick lines; see text). Second row from top: GSMF for the star-forming population of the four simulations (colored lines) with a unique star-forming criterion from Davé et al. (2019, see text). The gray-shaded area is based on the published star-forming GSMFs in the COSMOS field (see text). Second row from bottom: Same as above but for the whole (star-forming + quiescent) population. The gray area shows the observed total GSMF from the COSMOS field (Weaver et al. 2022) except at z = 0, where we use Bernardi et al. (2013) and Li & White (2009). Bottom row: Evolution of the star-forming MS for the COSMOS2020 data set with the SFR based on the NrK method (gray shaded area; see text) and the simulations (colored dots).
Current usage metrics show cumulative count of Article Views (full-text article views including HTML views, PDF and ePub downloads, according to the available data) and Abstracts Views on Vision4Press platform.
Data correspond to usage on the plateform after 2015. The current usage metrics is available 48-96 hours after online publication and is updated daily on week days.
Initial download of the metrics may take a while.