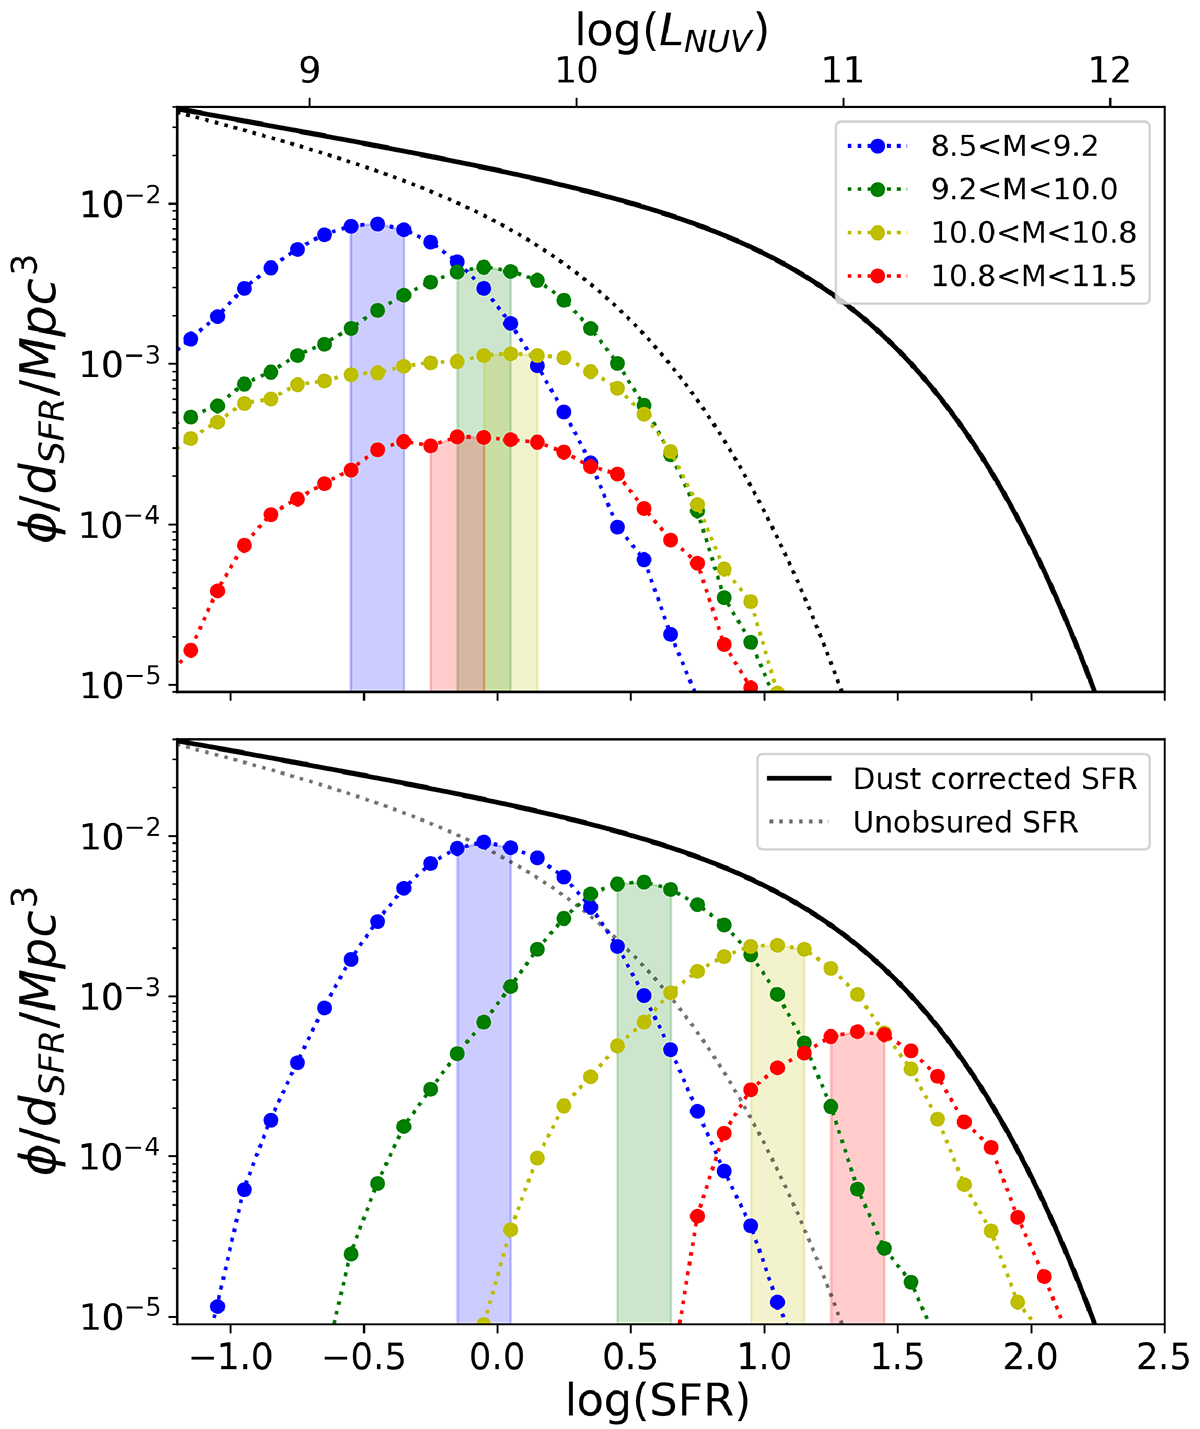
Fig. 13.
Download original image
Impact of dust correction on the shape of the SFR functions. The unobscured (upper panel) and dust corrected (lower panel) SFR functions are shown for different stellar mass bins (in color) and the whole sample (solid and dotted black lines) in the range 0.6 ≤ z ≤ 1.0. One noticeable feature of the dust correction is the ability to dissociate the SFR functions for each stellar mass bin with a larger correction at high masses and to modify the SFR functions per stellar mass bin from an asymmetric to a nearly Gaussian distribution.
Current usage metrics show cumulative count of Article Views (full-text article views including HTML views, PDF and ePub downloads, according to the available data) and Abstracts Views on Vision4Press platform.
Data correspond to usage on the plateform after 2015. The current usage metrics is available 48-96 hours after online publication and is updated daily on week days.
Initial download of the metrics may take a while.