Fig. 9.
Download original image
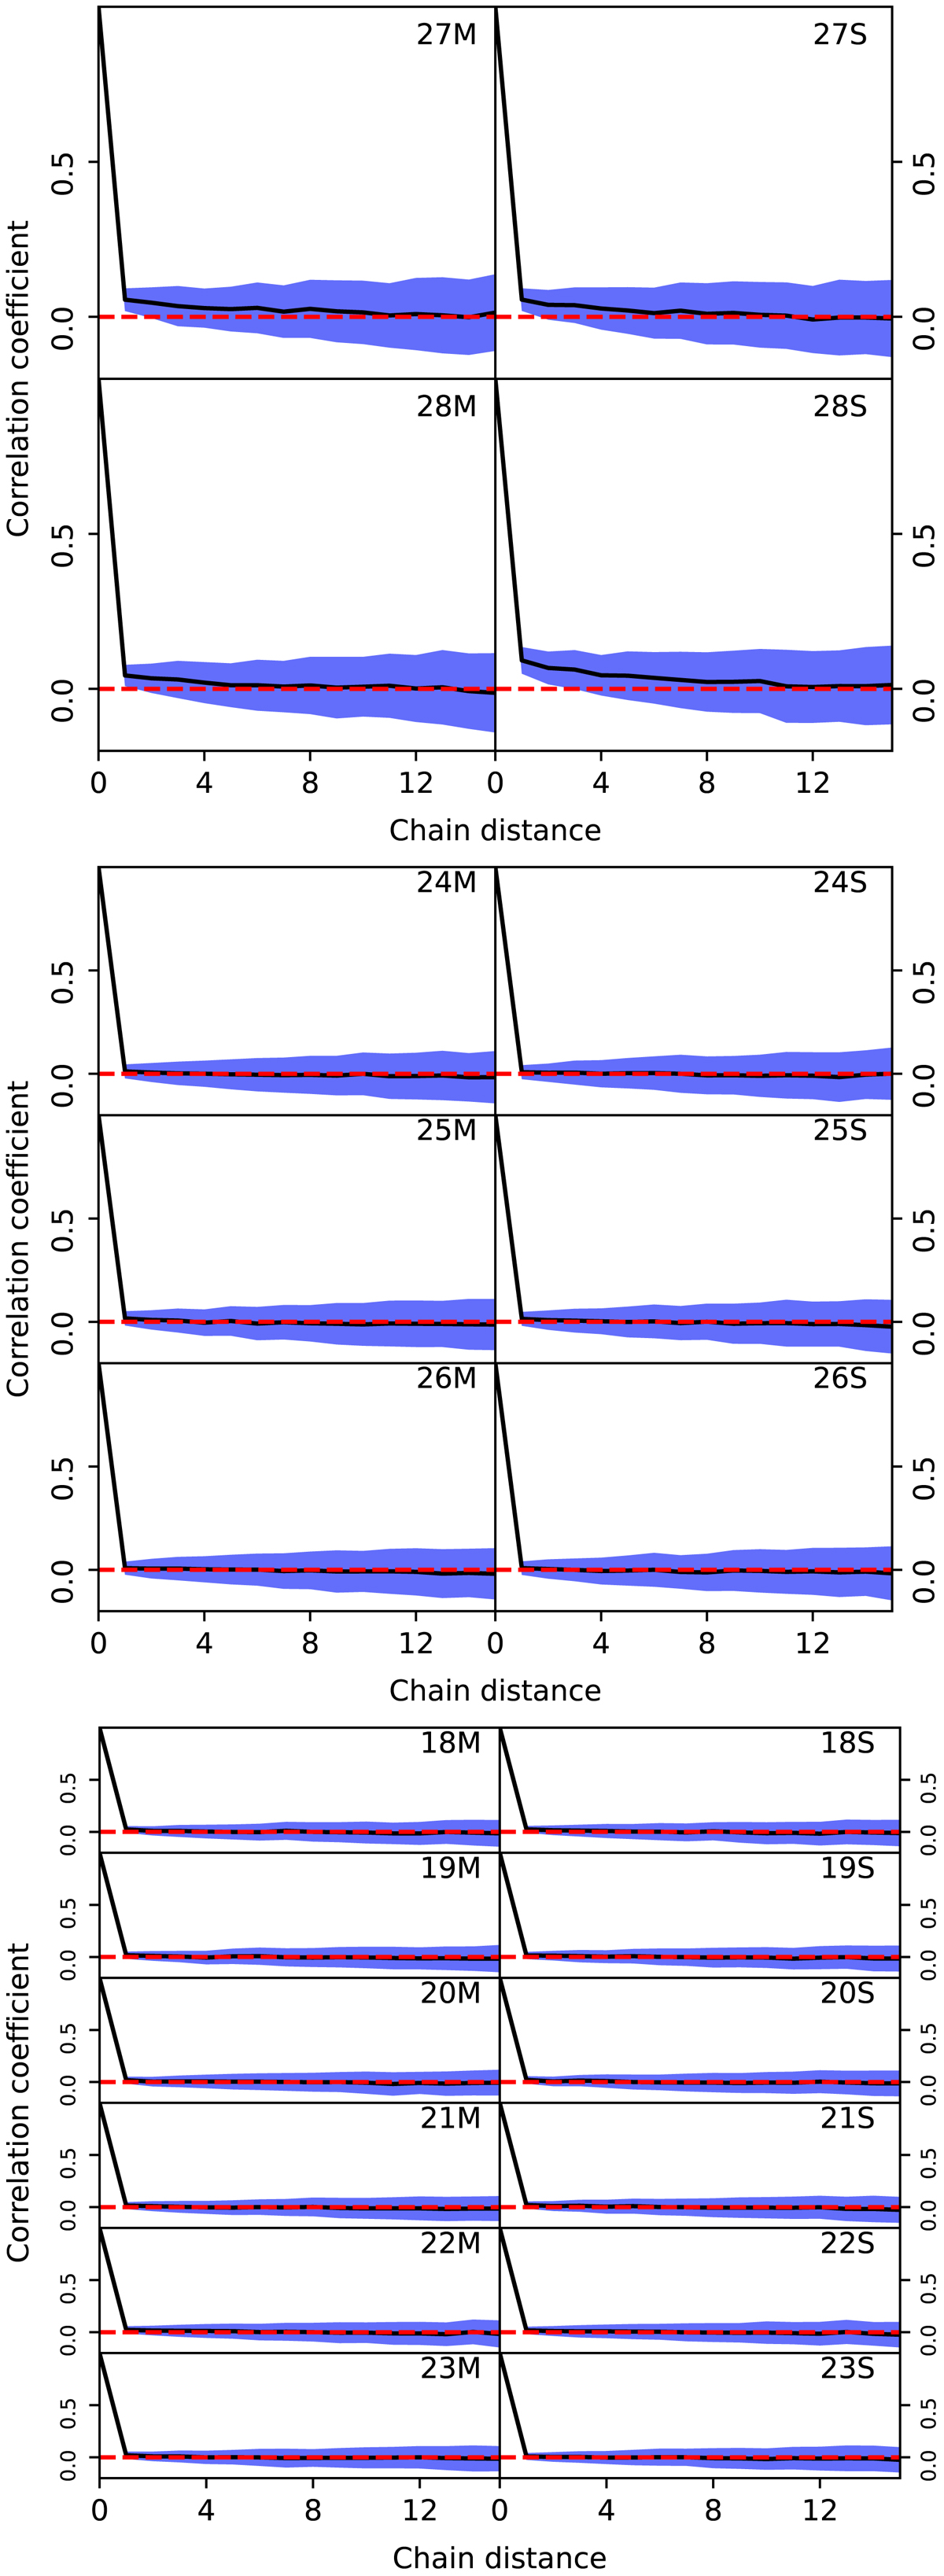
Correlation coefficients as a function of distance between Gibbs samples for 30 (top panel), 44 (middle panel), and 70 GHz (bottom panel) detectors. The black thick line shows the mean value for all PIDs, while the blue band shows the 1σ error bars.
Current usage metrics show cumulative count of Article Views (full-text article views including HTML views, PDF and ePub downloads, according to the available data) and Abstracts Views on Vision4Press platform.
Data correspond to usage on the plateform after 2015. The current usage metrics is available 48-96 hours after online publication and is updated daily on week days.
Initial download of the metrics may take a while.